greater in 1998. This relationship does not occur in January. In January 1995, a larger areal
extent of first-year thick ice is found, but a greater spatial extent of multi-year ice occurs in 1998.
The GIS enables a detailed investigation of the sea-ice thickness during these periods.
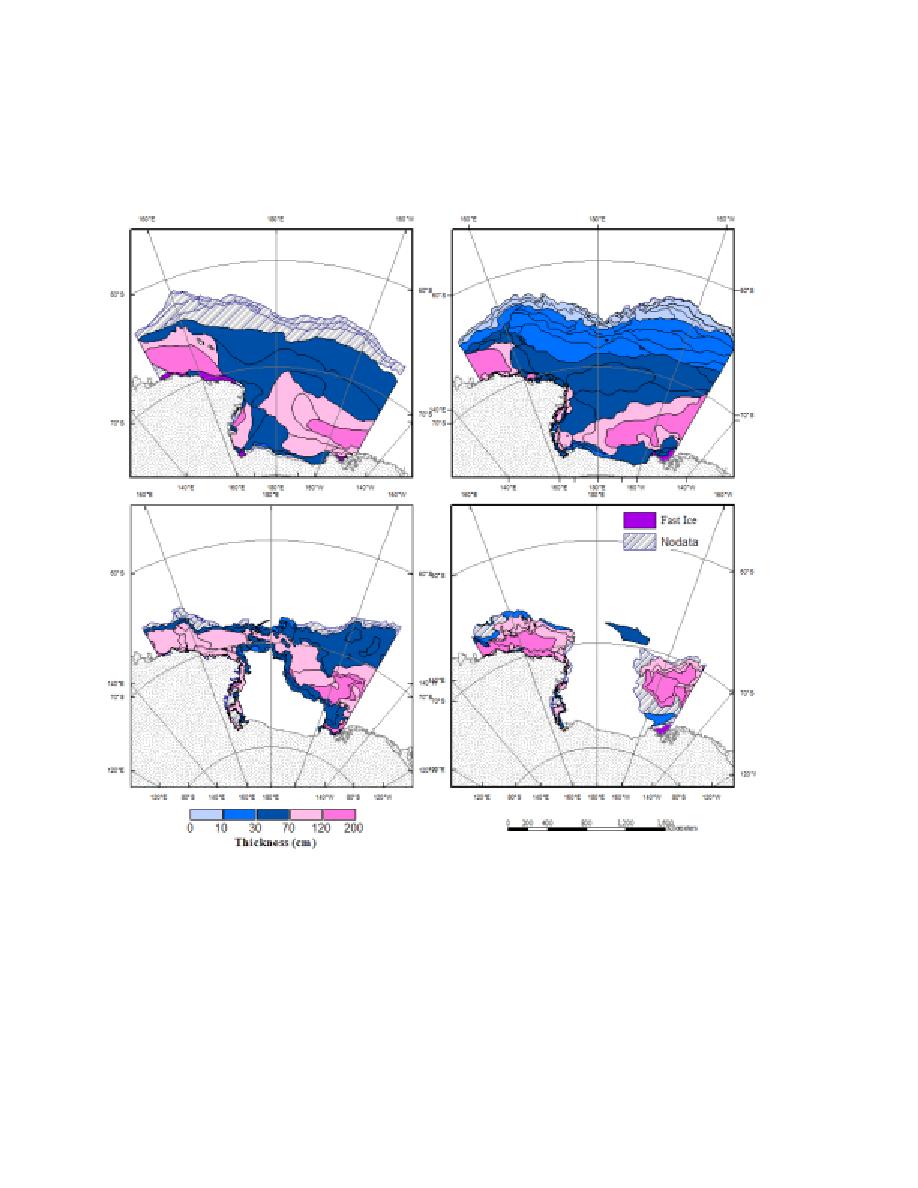
Figure 8. Sea-ice thickness during the week of June 8, 1995 (upper left) and 1998 (upper right)
and January 24, 1999 (lower left) and 2000 (lower right).
ArcGIS 3D Analyst extension provides an enhanced view of sea-ice conditions (Figure
9a) not offered in GIS's traditional flat plane view of an area (Figure 8). In addition, the errors
associated with a field can be draped over the field of interest. Figure 9b displays the uncertainty
in the sea-ice thickness estimates (Figure 9a) draped over the thickness field. The thickness
errors are color coded with the smallest errors shown in green graduated to the largest errors in
red. The thinnest sea ice (0-10 cm) along the fringe of the ice pack contains errors of 2.5-5 cm
(shown in green) and the thickest ice (120-200 cm) with errors of 35cm (shown in red). These


 Previous Page
