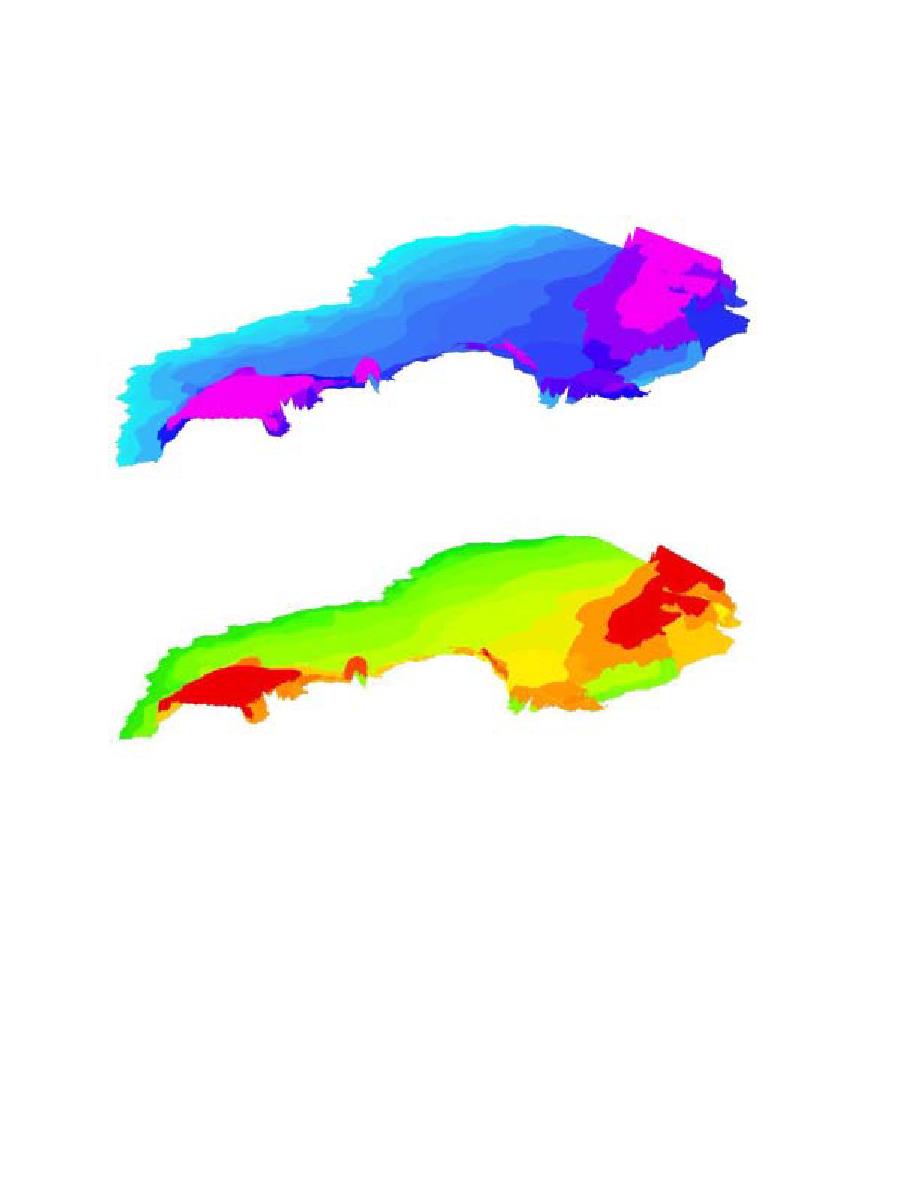
error estimates are important to determine the quality of sea-ice thickness and mass balance (not
shown). This is critical in the context of quantifying the variability and the detection of trends in
the data to verify if the results are statistically significant.
Figure 9a. 3-dimensional display of sea-ice thickness during the week of June 8, 1998
with thin ice displayed in light blue and thick ice shown in purple.
Figure 9b. Sea-ice thickness errors (light green represents small errors gradating to large errors
displayed in red) draped over 3D sea-ice thickness field (Figure 9a).
One of the main goals of this research is to compute monthly thickness distribution for
the Ross Sea. The term "thickness distribution" refers to how ice is distributed from its thinnest
to thickest form with the variability of that distribution of great interest over the seasonal cycle.
During the 1998 annual cycle, the growth and melt seasons are resolved in percentages of open
water and thin and thicker ice types. In the decay season, the sea-ice pack is largely distributed
between open water and the thickest ice that has survived the melt season (1st year medium/thick
and multi-year ice), while in July through September the pack is distributed into the thinner ice
categories as the growth season is reaching its maximum in September.


 Previous Page
