Table 2. Roof cut A, test results.
Moisture
Thermal resistance
content
Thickness
Density
(% of
As
After
TRR
(lb/ft3)
Insulation
(in.)
dry weight)
received
drying
(%)
EPS
2
1.0
14.7
7.2
7.4
97
FGL
2
8.0
2.6
7.9
8.1
98
FGL
3
6.0
14.8
3.9
10.9
36
Notes:
TRR = (as-received thermal resistance 100)/after-drying thermal resistance.
An additional 1-in. layer of frozen FGL existed below the two layers sampled. It was full of
ice and could not be removed intact for testing. Core 8 sampled this material. It had lost most
of its insulating ability.
cores 1 and 2 were subsequently taken. The indi-
conditions (steady state in the prior CRREL stud-
vidual is marking the area where core 8 and cut A
ies and somewhat transient in these studies), and
were taken. Core 13, taken nearby where shown
the ease with which moisture moves about in fi-
in Figure 2, was outside this bright (wet) area. All
brous glass insulation explain the difference.
insulation was dry where core 13 was taken. Thus
Infrared roof moisture surveys were also con-
it appears that only a small area of wet (frozen)
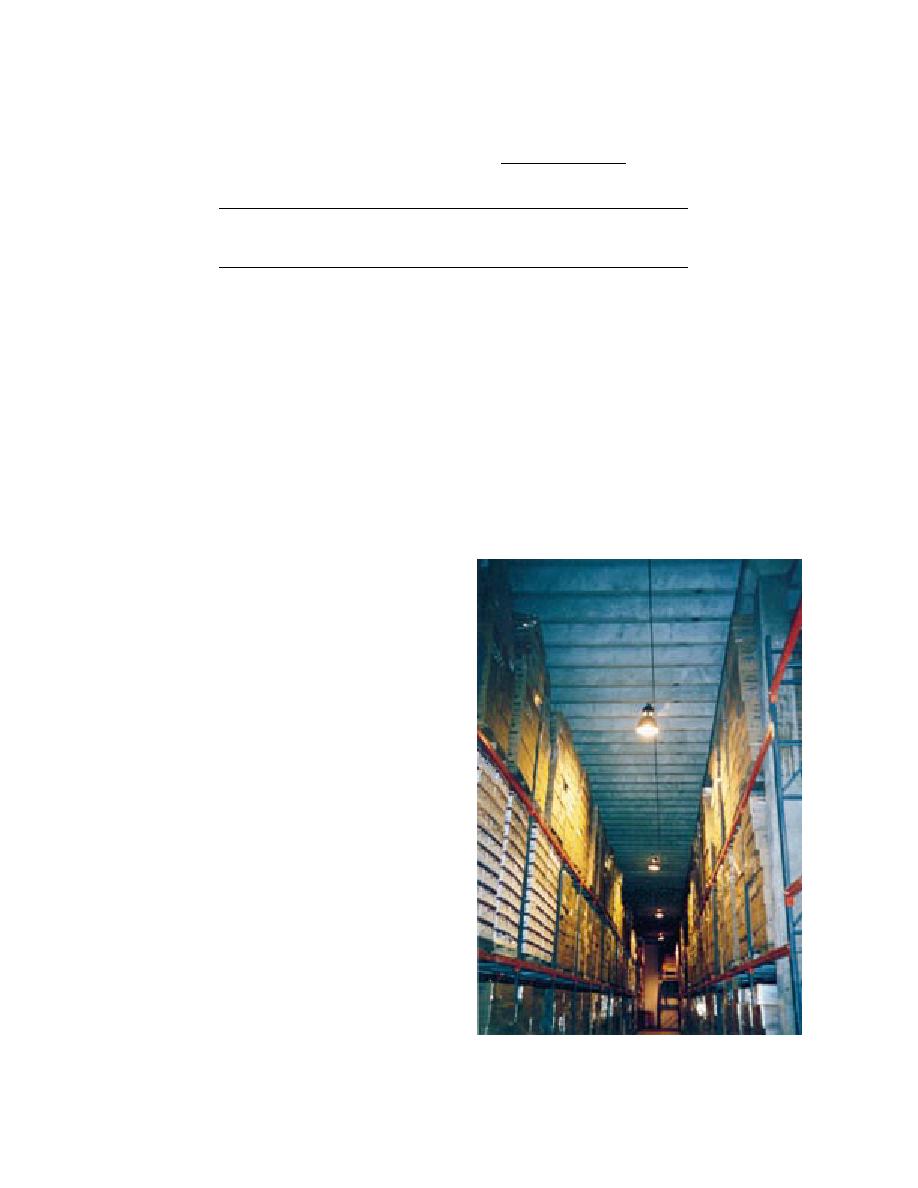
ducted from within this freezer. Figure 9 is a gen-
fibrous glass insulation is present in the southeast
eral view of the interior showing the deck of pre-
corner of this roof. No obvious flaw was uncov-
cast concrete double-tee beams. Figure 10 presents
ered that could be held responsible for this prob-
lem. It is likely that the flaw was in the old mem-
brane, and the wetness has been present since the
old bituminous built-up membrane was overlaid
with additional insulation and a ballasted EPDM
membrane. Because this moisture is located deep
in the roof, not near its top, the thermal anomaly
should have been dark not bright. Since it was
bright, something else is happening here. One pos-
sibility is that moist, warm air is infiltrating into
this portion of the roof below the old membrane.
Figure 2 shows where 12- 12-in. roof cut A
was made. Results of tests run on the components
of that cut are presented in Table 2. Core 8 was
taken at the same place as cut A. Both found the
expanded polystyrene insulation and the upper
layer of fibrous glass insulation to be dry. How-
ever, the lower layer of fibrous glass obtained in
cut A contained considerably more moisture than
the similar layer in core 8 (14.8% vs. 1% by weight).
In all likelihood, some of the wet fibrous glass be-
low was collected in the cut while it was all left
behind in the core. Prior CRREL studies (Tobiasson
et al. 1991) indicate that fibrous glass with a mois-
ture content of 14.8% by weight would have about
93% of its dry insulating ability (i.e., it would have
a Thermal Resistance Ratio [TRR] of 93%). How-
ever, the TRR obtained by measuring the insulat-
Figure 9. Interior view of the freezer below roof D1,
ing ability of these fibrous glass specimens before
which has a precast concrete deck.
and after drying them was only 36%. Differing test
6


 Previous Page
