N
168 ft
223 ft
324 ft
G & 16*
H & 20*
I & 14*
19
15
18
242 ft
17
A-1
A-2
A-3
(0F)
(0F)
(0F)
Lower Roofs (not examined)
Core (2 in. diameter)
Cut (12 in. 12 in.) and Core (2 in. diameter)
*Cuts are lettered; Cores are numbered.
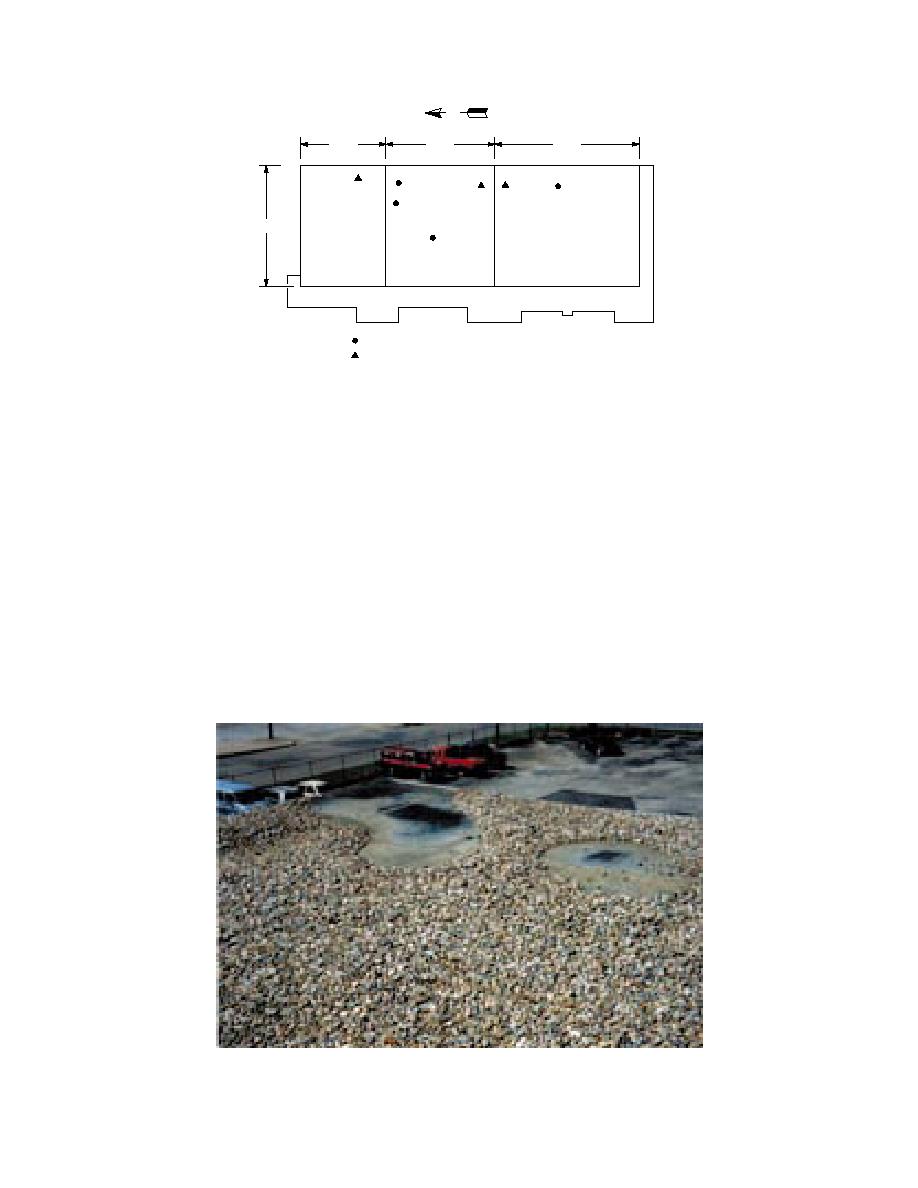
Figure 3. Plan view of the three roofs examined in Arlington, Texas.
insulation (7 in. [17.8 cm]) and a concrete deck.
isted directly below. A large cancer of wet insula-
The temperature of the freezer below this roof was
tion had not developed in this area, because little
0F (18C).
water drains across it and none ponds there. This
The daytime visual inspection revealed that bal-
flaw was patched by SRC in conjunction with our
last scour by wind existed in the northwest corner
other work.
(Fig. 4); a portion of the north edge metal was de-
Bright areas were also detected by the infrared
pressed below the level of the membrane (Fig. 5);
scanner in the southeast corner of this roof. Core
and a failed patch (Fig. 6) existed along the north
samples 1, 2, and 8 and roof cut A were taken in
edge 115 ft (35 m) from the northwest corner.
this area (Fig. 2). Table 1 presents all core sample
The nighttime on-the-roof infrared survey un-
findings for this roof. The bottom 1 to 3 in. (2.5 to
covered only a small area of brightness (Fig. 7) at
7.6 cm) of fibrous glass insulation in this area was
the failed patch shown in Figure 6. Finger prob-
frozen "solid" (i.e., it was full of ice). Figure 8
ing into the flaw revealed that wet insulation ex-
shows the two areas of cleaned membrane where
Figure 4. Ballast scour in the northeast corner of roof D1.
3


 Previous Page
