Hydraulic Conductivity (cm/s)
Hydraulic Conductivity (cm/s)
1x10⁻¹⁰ 1x10⁻⁹ 1x10⁻⁸ 1x10⁻⁷ 1x10⁻⁶ 1x10⁻⁵ 1x10⁻⁴ 1x10⁻³
1x10⁻¹⁰ 1x10⁻⁹ 1x10⁻⁸ 1x10⁻⁷ 1x10⁻⁶ 1x10⁻⁵ 1x10⁻⁴ 1x10⁻³
0.0
0.0
0.2
0.2
Before f/t
After f/t
Before f/t
After f/t
0.4
0.4
Maximum
Blo
Block Sample Tests
Frost Depth
0.6
0.6
Maximum
Frost Depth
No Freezing
0.8
0.8
No Freezing
0.0
0.0
Frozen
0.2
0.2
Frost Depth
After
Jan 21,1992
Freeze-thaw
No
0.4
0.4
Freezing
Fro
Frozen Core Sample Tests
0.6
0.6
0.8
0.8
Field
Field
Before Freezing
Before Freezing
0.0
0.0
0.2
0.2
Before f/t
After f/t
0.4
0.4
Before f/t
After f/t
La
Laboratory Freezing Tests
0.6
0.6
0.8
0.8
Field
Field
Before Freezing
Before Freezing
0.0
0.0
Tube Sample
0.2
0.2
Tube Sample
After Thawing
Block
After Thawing
Before
0.4
0.4
Freezing
Maximum
Tu
Tube Sample Tests
Frost Depth
0.6
0.6
Block
Before
0.8
0.8
Freezing
1.0
1.0
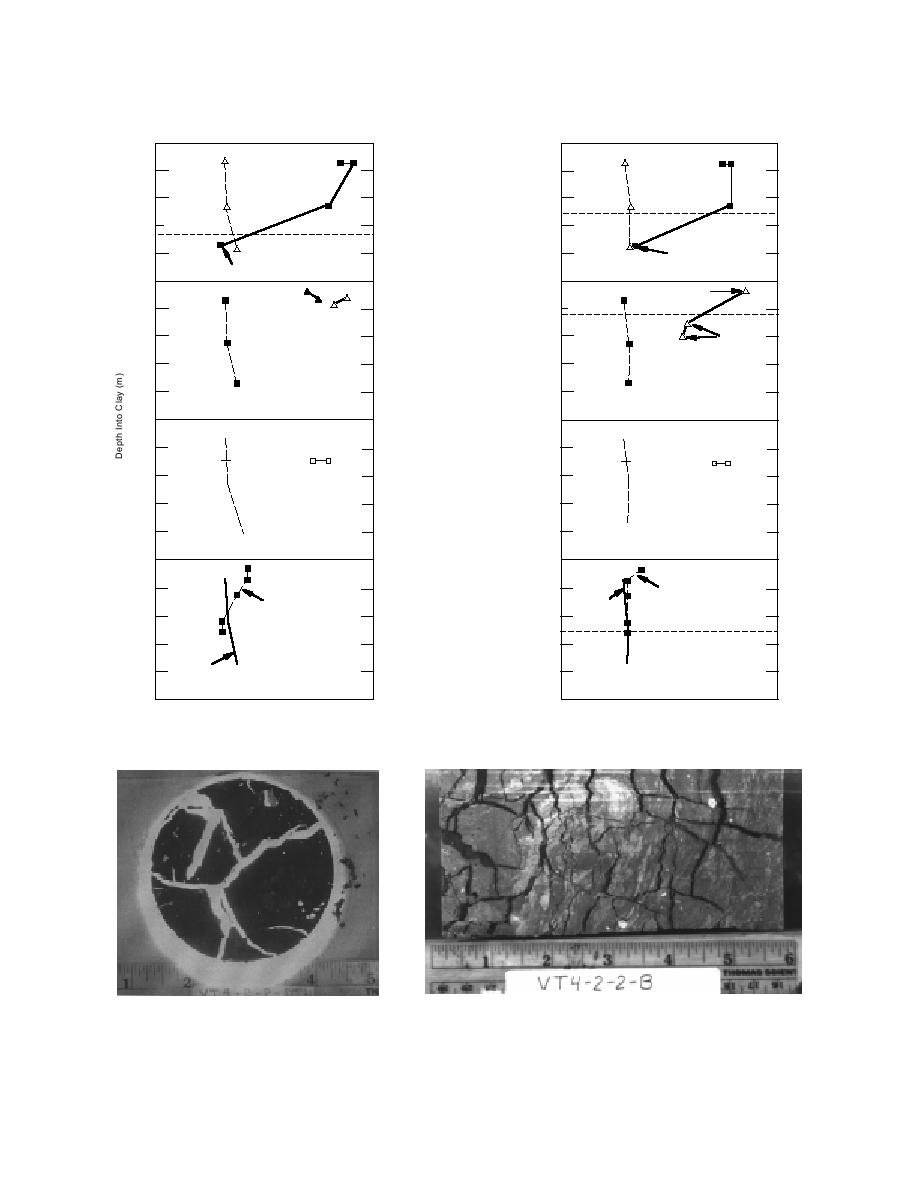
b. Valley Trail clay.
a. Parkview clay.
Figure 8. Summary of hydraulic conductivity test results.
Figure 9. Thin section of a horizontal slice
Figure 10. Vertical half section of Valley Trail frozen core. Note
of frozen Valley Trail clay. Note thick ice
both ice-filled shrinkage cracks and ice lenses (black) surround-
features (white) in shrinkage cracks sur-
ing clay aggregates (gray-white).
rounding clay aggregates (black).
10


 Previous Page
