tory and field. Thin slices, cut from frozen speci-
mens with a band saw, were mounted on glass
plates and milled thin to allow transmitted light to
show through the included ice features. They were
then photographed in a coldroom on a Polaroid
camera light stage with both incident and trans-
mitted light. In addition, scanning electron micro-
scope (SEM) photographs were made of the test
materials before and after freezing and thawing to
examine the microstructure changes. Photographs
were also made of the soil structure in the field
after freezing and thawing in the pits from which
the large-diameter field test samples were carved.
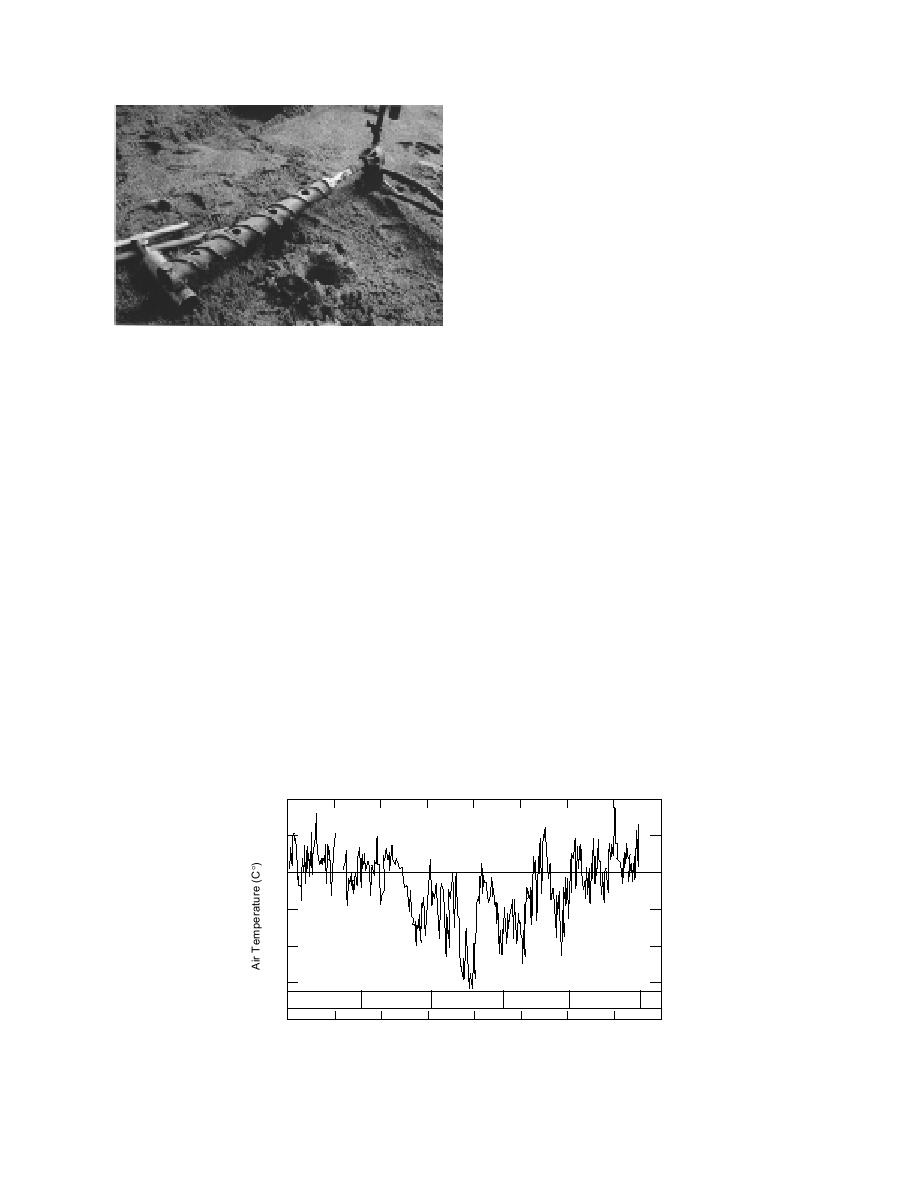
Figure 5. CRREL auger for taking a frozen core from
the test pads.
TEST RESULTS AND OBSERVATIONS
before freezing in December 1992, and after the
Temperatures
site thawed in the late spring 1993. Thin-wall
Temperatures at the site were monitored in the
tubes of 2.8 in. (7.1 cm) diameter were also
air and in the ground over two winters, 199293
pushed into the thawed test pads to collect speci-
and 199394, and recorded hourly. A typical air
mens in June 1993. Benson et al. (1994) describe
temperature plot is shown in Figure 6, and an
the sampling procedure in detail.
example of a plot of the freeze and thaw depths
Hydraulic conductivity tests were also done
during a winter is illustrated in Figure 7. Freeze
on test specimens prepared from frozen cores that
thaw cycling started in November of both winters.
were collected from the sandbentonite, Park-
By mid- to late December, the freezing rate was
view clay, and Valley Trail clay test pads in March
steady. Frost reached the bottom of the test sections
1993 and March 1994. The frozen specimens were
by mid- to late January and remained there for
collected using a special rotary coring device (Fig.
about a month. In mid-February, shallow, top-
5) developed by CRREL. The 2.8-in.-diameter fro-
down freezethaw cycles started, and in mid- to
zen cores were packed and shipped frozen to the
late March, thawing began in earnest from both the
CRREL laboratory and maintained in a coldroom
bottom and top of the test pads. Thawing was com-
until they were prepared for testing. Benson et al.
plete by the first week of April in both winters. The
(1994) describe the sampling procedure in detail.
test sections were frozen for about 3.5 months each
winter. The freezing records for both winters show
that, once freezing was established, little of the
Analysis of soil structure
Thin sections were made of specimens of clay,
freezethaw cycling that occurred in the granular
sandbentonite, and GCLs frozen in the labora-
cover material reached the test materials.
20
10
0
-10
-20
-30
Nov
Dec
Jan
Feb
Mar
-40
0
20
40
60
80
100
120
140
160
Days Since November 1, 1993
Figure 6. Air temperature record for the winter of 199394.
8


 Previous Page
