0.00
-0.25
Frozen
-0.50
-0.75
-1.00
Nov
Dec
Jan
Feb
Mar
-1.25
0
20
40
60
80
100
120
140
160
Days Since November 1, 1993
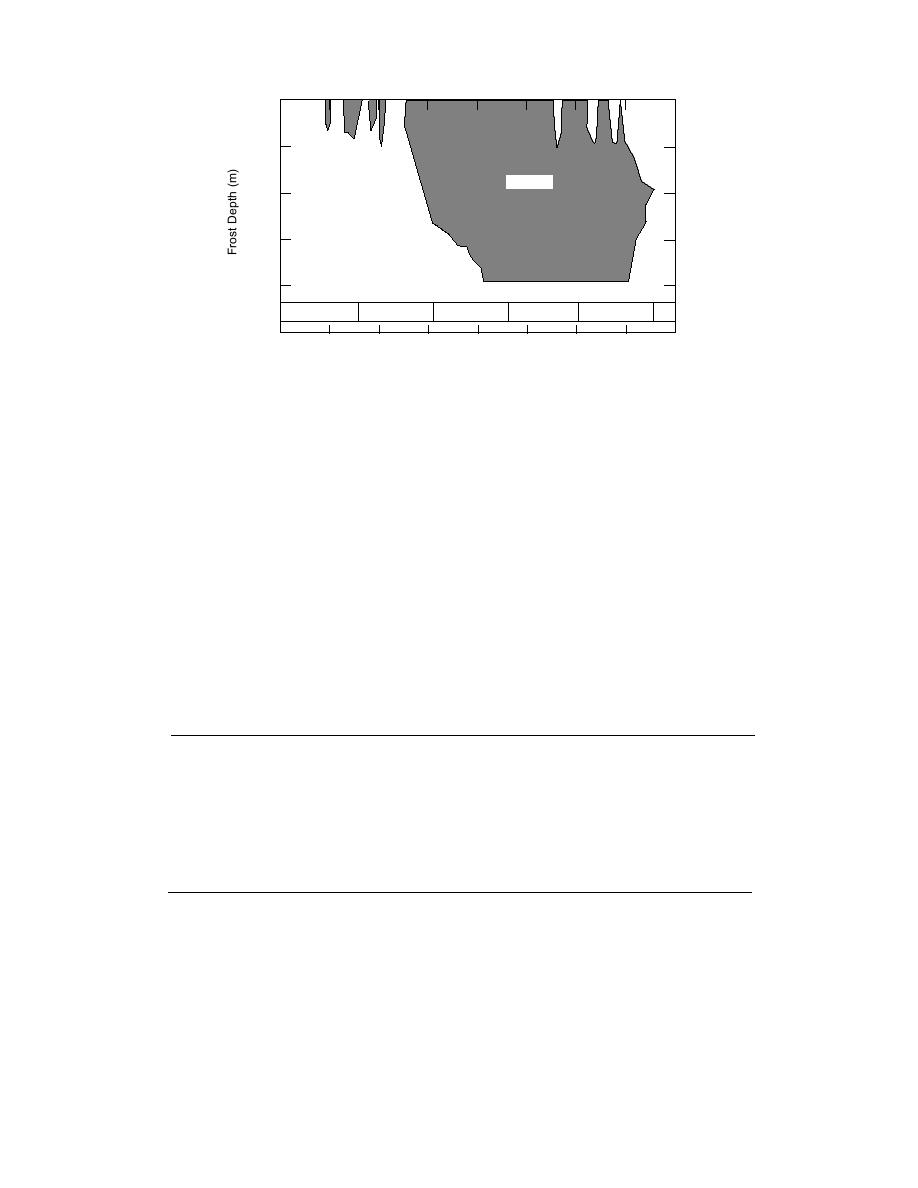
Figure 7. Example of the freeze and thaw depths during the winter of 199394.
Hydraulic conductivity of
Fig. 8). The increase in hydraulic conductivity for
the Parkview clay was from about 3 108 cm/s
clays and sandbentonite
to greater than 1 104 cm/s. For the Valley Trail
Table 2 shows a summary of the average hy-
clay, the increase was from about 2 108 cm/s to
draulic conductivity measured for each material
about 8 105 cm/s.
during different stages of the investigation.
This increase in hydraulic conductivity is
Natural clay
attributed to the formation of cracks from ice
Comparisons of our laboratory and field tests
lenses and shrinkage. Thin sections (Fig. 9) and
on the two natural clays (Parkview clay and Val-
half sections (Fig. 10) cut of these materials show
ley Trail clay) show that freezethaw cycles
the ice-filled cracks between aggregates of soil. A
caused an increase in hydraulic conductivity of
scanning electronic microscope (SEM) photo-
three to four orders of magnitude (Table 2 and
graph (Fig. 11) shows further detail of a crack
Table 2. Summary of hydraulic conductivity measurements (cm/s) on the clay and sand
bentonite materials.
Parkview
Valley
Sand
clay
Trail clay
bentonite
Test details
(PV-3)
(VT-4)
(SB-1)
2.3 108
1 108
< 1 108
CRREL laboratory (a) before breeze
3 108
2 108
1 108 (h)
UW laboratory before freeze (b)
1.6 105
< 1 108
1 105
CRREL laboratory (a) after 10 freezethaw cycles
5.3 105
8 105
Frozen core in CRREL laboratory (c) after thawing
Specimen piped
1.4 104
1 105
UW laboratory after 1 winter; upper 0.2 m (d)
Specimen piped
4.5 105
2.6 105
UW laboratory after 1 winter at 0.45 m depth (d)
Specimen piped
2.5 108
2.2 108
UW laboratory after 1 winter at 0.75 m depth (d)
Specimen piped
3 108
2 108
UW laboratory after 1 winter (thin-wall tube) (e)
Not sampled
5 108
Field test pad permeameter after 2 winters (f)
Could not read
Not tested
6.9 107
3.6 108
CRREL laboratory tests with increased confining pressure (g)
Not tested
a
7-cm-diam. specimens prepared in the CRREL laboratory.
b
30-cm-diam. specimens carved from field test pads (Dec. 1992).
c
7-cm-diam. specimens taken from test pads by CRREL frozen soil coring device (March 1993).
d
30-cm-diam. specimens carved from field test pads (June 1993).
e
7-cm-diam. specimens taken from test pads with thin-wall steel tube (June 1993).
f
Hydraulic conductivity of Parkview clay was so high after one winter season that the capacity for measur-
ing seepage through the field permeameter was exceeded, therefore the hydraulic conductivity was not
read.
g
The hydraulic conductivity presented is after freezethaw with confining pressure increased to 7075 kPa.
h
This hydraulic conductivity k is from one of three specimens. The two other specimens appeared to have
low bentonite content, showing hydraulic conductivities of 1 x 106 cm/s. They are not shown because of
the piping.
9


 Previous Page
