99
98
95
90
70
50
30
10
5
2
0.1
1.0
4.0
QC
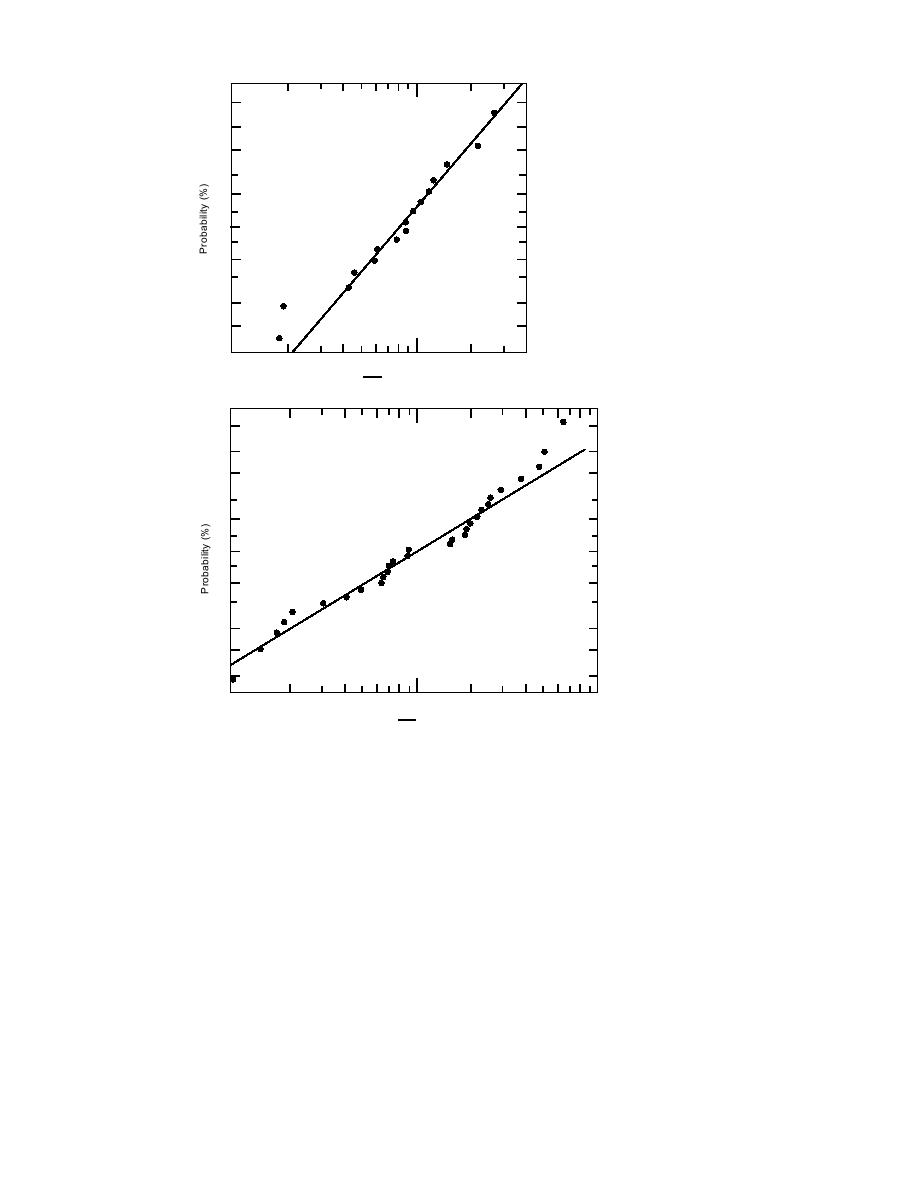
a. Ethylbenzene.
Ethylbenzene
Concentration Ratios
QA
99
98
95
90
70
50
30
10
5
2
0.1
1.0
10
QC
b. Toluene.
Toluene
Concentration Ratios
QA
Figure 6. Lognormal probability plots for QC/QA concentration ratios for soil VOCs.
likely we are to experience biases and the more
and, therefore, they omit all error associated with
difficult it becomes to identify them.
sample collection, transport, storage, and extrac-
What about the QC results from matrix spike/
tion. Assuming that the solution used for spiking
matrix spike duplicates (MS/MSD)? We could find
is prepared independently from the calibration
no meaningful correlation between these results
standards (frequently untrue), MS/MSD results
and the degree of agreement between QC and
can serve to validate calibration and to reveal spe-
QA laboratories. Similar failure of MS/MSD re-
cific interferences from the matrix under analysis.
sults as a quality indicator for VOCs was recently
Does this imply that calibration variations do not
reported by Robertson et al. (1995). Generally
contribute to the disagreement between laborato-
speaking, the MS/MSD results appeared to be
ries? The answer is no. Significant bias may be
quite satisfactory and suggestive of much greater
introduced from calibration errors, but we do not
reliability than was actually obtained on co-lo-
believe it is the major source of error. In contrast
cated samples. However, we must remember that
to the soil results, we found that most QC/QA
MS/MSD results are derived by spiking extracts
ratios for GC-MS determination of VOCs in
10


 Previous Page
