(NPD) contained 83 pairs of replicate QC results
3
with concentrations above reporting limits, and
95 pairs with both QC and QA results above re-
2
porting limits. For these data, 6.0% of QC1/QC2
^
y = 0.134 + 0.795x
ratios and 13.7% of QC1/QA ratios were outside
"r" = 0.906
0.254.00 (Table B5). We concede that these limits
1
are arbitrary, but they form a reasonable starting
point and the rejection rate for QC/QA is only
moderately greater than 10%, which we consider
0
an acceptable goal. As noted in the VOC section,
we believe that it is imperative to seek improve-
ments in procedures that yield widely divergent
1
results.
In contrast to the results from contractors re-
porting to NPD, 28 of the 61 pairs (45.9%) of QC/
2
2
1
0
1
2
3
QA ratios from the Missouri River Division (MRD)
QC
Ethylbenzene Log
Concentration Ratio
databank were outside 0.254.00. No replicate QC
QA
values were included on these data reports. The
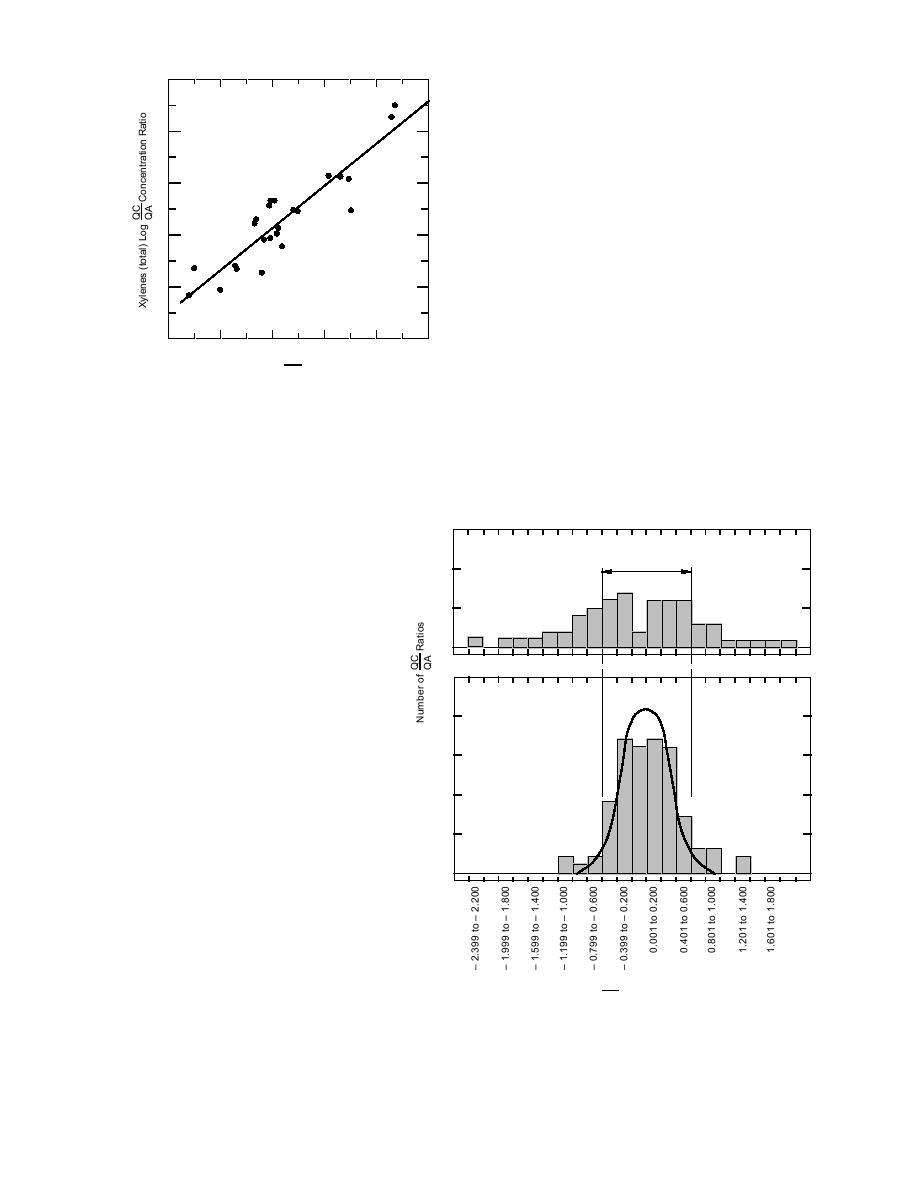
Figure 7. Correlation of log concentration ratios for
histograms of log QC/QA ratios shown in Figure
total xylenes and ethylbenzene in soil.
8 provide a very clear depiction of the difference
in dispersion for the two data sets. The lognor-
mal model appears to be a reasonable fit to the
sults. Hewitt et al. (1995) state, "Only those sam-
NPD QC/QA ratios between 0.254.00. This hy-
pling methods that maintain soil structural integ-
pothesis is reinforced by the probability plot of
rity, use a single soil transfer step, and preserve
against biological degradation should be
15
used when establishing VOC concentra-
Boundaries Corresponding to
tions." A tipless plastic syringe is sug-
MRD Results
Ratios 0.25 to 4.00
gested for obtaining soil samples, which
10
are immediately transferred to VOC vi-
als containing either methanol or water
5
acidified with NaHSO4. Details of this
approach, which satisfies SW-846, Method
0
8260A, are available from Hewitt. We be-
lieve that it is imperative for the Corps to
25
consider this or alternative methods to
NPD Results
improve the quality of analytical results
20
for VOCs in soil.
In contrast to the 42% of archived QC/
15
QA ratios outside 0.254.00, only 23% of
the most recent results (44 samples from
10
11 project locations) were outside of these
limits. It is interesting to note that 20% of
5
the QC1/QC2 ratios were also outside
0.254.00 (no QC1/QC2 values were avail-
able in the original archived data). Of the
0
20%, 17% of the ratios were above 4.00,
i.e., the first value was much larger than
the second value. Perhaps VOCs were be-
ing lost during storage, thus causing the
second values to be low.
QC
Logs of
Concentration Ratios
QA
TPH in soils
Figure 8. Comparison of frequency histograms of soil TPH
The 102 data reports for TPH in soils
QC/QA concentration ratios from NPD and MRD.
submitted by the North Pacific Division
12


 Previous Page
