

The poor agreement of the tolerance intervals with
nested experimental design could be used to de-
the editing limits implies that the standard devia-
termine the magnitude of these errors prior to
tion of the log ratios was larger than expected for
instituting corrective measures.
a good-fitting lognormal distribution. A look at
The GC-FID method may be a significant
the histogram (Fig. 8) shows that there are more
source of error for TPH determinations. Besides
ratios than expected toward the extremes and
inevitable random errors, the unique arrangement
fewer than expected in the center. Deficiency of
followed by the Corps of Engineers may allow
ratios near the ideal value of 1.00 (log = 0) may
systematic errors such as calibration or signal in-
be due to systematic bias as suggested in later
tegration biases to appear as random error. We
paragraphs.
refer to the use of a given laboratory for the QA
As with the VOCs, we found no meaningful
function on one project and for the QC function
correlation between either surrogate recoveries or
on another project. Thus, if a laboratory reports
MS/MSD results with corresponding QC/QA ra-
consistently low results, they would inflate QC/
tios. In many cases MS/MSD results were absent
QA ratios when serving as a QA laboratory but
or were indicated to be unavailable because they
they would depress ratios when acting as a QC
were diluted out of range. In other examples ex-
laboratory.
hibiting very poor agreement between QC and
We believe that GC-FID for TPH is susceptible
QA results, surrogate recoveries were excellent
to systematic error, especially in the integration
and MS/MSD results were quite good. We must
of peaks on chromatograms with broad undiffer-
ask whether MS/MSD results are providing
entiated background. This is particularly true for
enough useful information to justify the cost. Per-
weathered residues where the normal hydrocar-
haps the use of independently prepared second-
bons, which produce a very recognizable pattern
ary standards would offer greater cost/benefit.
in fuels, have been reduced relative to the
More will be said on this later.
branched chain components. Evidence of bias is
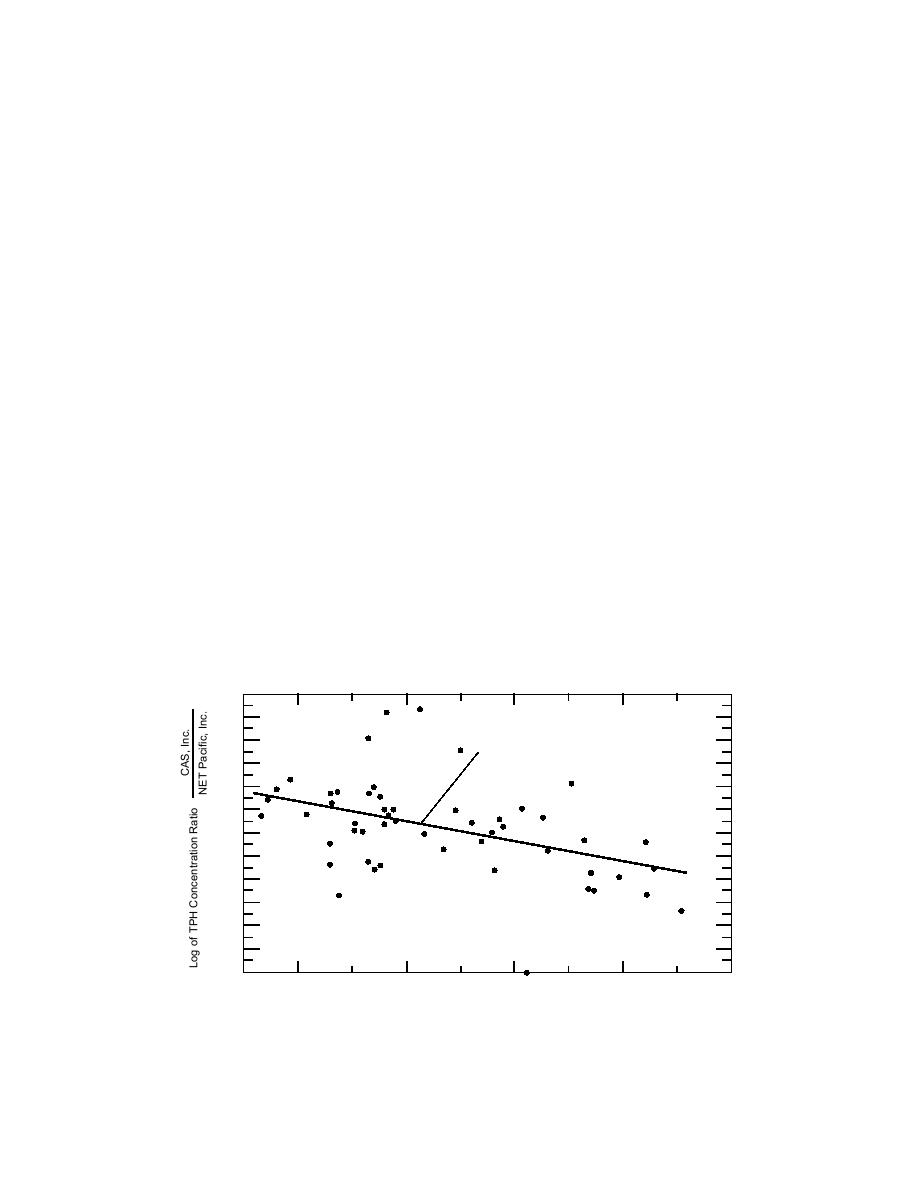
Some of the random error undoubtedly arises
found in Figure 12. NET Pacific, Inc., Santa Rosa,
as a consequence of sampling and splitting soils
California, was the QA or the QC laboratory for
with heterogeneously distributed petroleum hy-
all 95 QC/QA ratios computed from NPD results.
drocarbons. Possibly contractor guidance can be
In 52 cases the other laboratory was CAS, Inc.,
revised to reduce this source of error. Volatiliza-
Kelso, Washington. NET Pacific was the QA labo-
tion seems unlikely to be a major source of error,
ratory 28 times and the QC laboratory 24 times.
but that too could be examined. Biodegradation
When we plotted the log of the concentration ra-
is another potential source of error. A well-planned
tios for CAS, Inc./NET Pacific, Inc. vs. the log of
1.4
1.2
1.0
y = 0.629 0.170x
"r" = 0.439
0.8
0.6
0.4
0.2
0
0.2
0.4
0.6
0.8
1.0
1
2
3
4
5
Log of TPH Concentration (ppm) Reported by NET Pacific, Inc.
Figure 12. Correlation of soil TPH concentration ratios for CAS, Inc./NET Pacific, Inc.
with soil TPH concentration estimates reported by NET Pacific, Inc.
14

 Previous Page
