99.9
99.9
98
98
90
90
70
70
50
50
30
30
10
10
2
2
0.10
1.0
0.10
1.0
3.0
3.0
QC
QC
Ethyl Benzene
Concentration Ratio
Toluene
Concentration Ratio
QA
QA
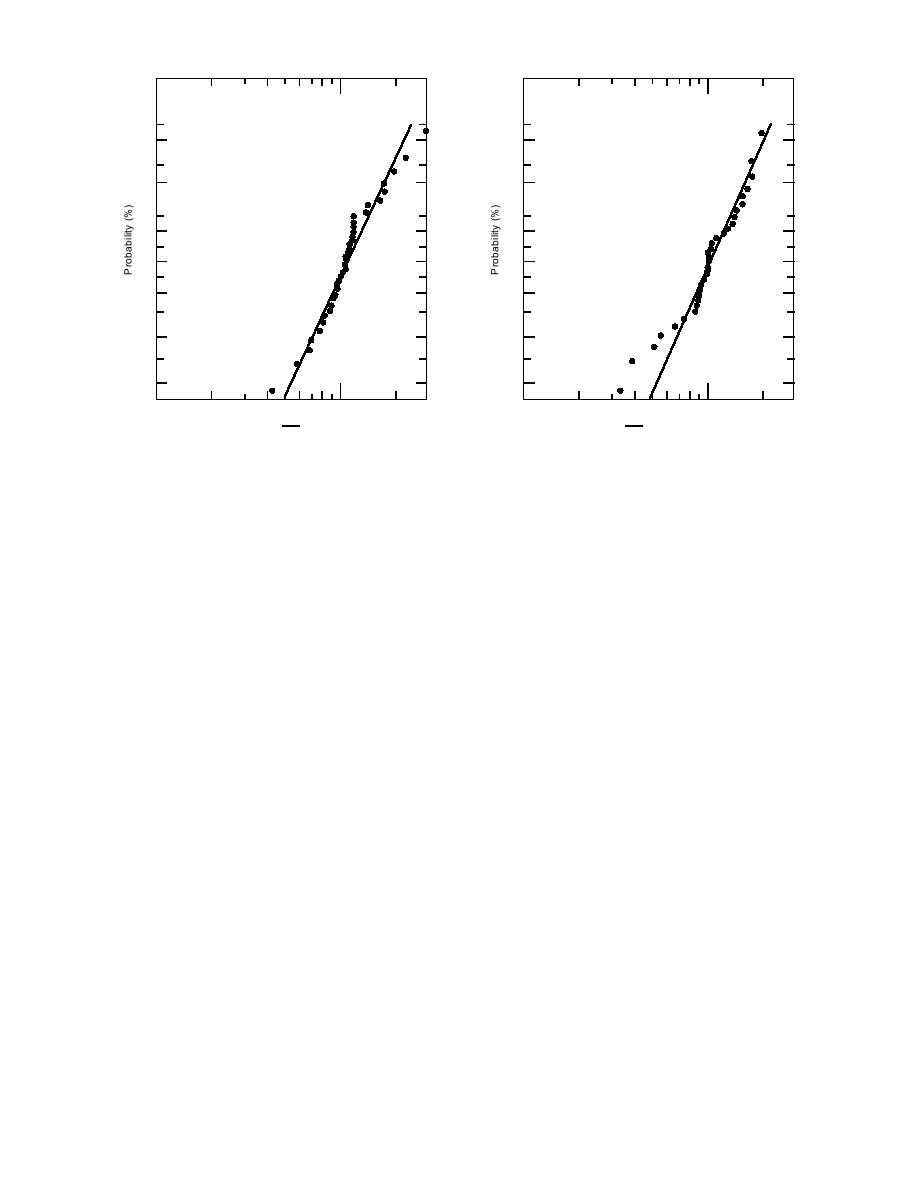
g. Groundwater/ethylbenzene ratio.
h. Groundwater/toluene ratio.
Figure 2 (cont'd).
two values were 5.0 g/g and ND < 0.80 g/g, as
These tolerance intervals represent the lower and
an example. Such comparisons were often unsat-
upper limits within which we may assume (99%
isfactory because the ranges of reporting limits
probability here to give minimal probability of an
were sometimes as wide as a factor of 1000 or
outlier) that all individual ratios in a set should
more.
fall. If an individual ratio is outside these limits,
Inconsistency with significant figures was a
it is assumed to be an outlier and it can be re-
problem throughout. For example, the QA labo-
jected. This decision is based on the assumption
ratory might report a result of 10.7 g/g and the
that the lognormal model is correct.
QC laboratory might give the matching result as
7. Assuming the expected (ideal) mean log of
8 g/g. The result 10.7 g/g implies uncertainty
0.00, obtain antilogs for t0.99(Sx) to + t0.99(Sx). De-
at the tenth of a g/g whereas the result of 8 g/
termine how many values are outside of these
g implies an uncertainty of 1 g/g. We will ad-
limits. NOTE: Do not count the outliers excluded
dress this problem with a recommendation in a
before these calculations were started.
later section, but for the purpose of our computa-
8. Repeat steps 2 through 7 for QC/QA ratios.
tions we will treat 8 g/g as though it is 8.0 g/
An example of these computations is presented
g. Similar problems were present for the report-
in Appendix A for the Cr results.
ing limit values.
When both QC and QA laboratories reported
Some analytes were determined by more than
"less than" values, the ratios of these values were
one method in different laboratories (inductively
checked to see if they were within a factor of 3.0
coupled plasma and graphite furnace atomic ab-
or 4.0, depending on the analyte. When one labo-
sorption in the case of lead, for example). We origi-
ratory reported a value above the reporting limit
nally intended to segregate results according to
and the comparison result was below the report-
method, but there were far too many data reports
ing limit, they were still compared using the ap-
lacking method information to permit this to be
propriate factor. For example, if one laboratory
reported 0.60 g/g and the other reported not
done. In reality, we expect properly calibrated
detected (ND < 1.0 g/g), they were in agree-
methods to yield comparable accuracy, so when
ment. But if one reported 0.60 g/g and the com-
numerical concentrations are reported using ac-
cepted methods, there should not be systematic
parison value was ND < 5.0, they disagreed be-
bias in the results. Of course, reporting limits will
cause the "less than" value was unacceptably high.
vary for different methods.
The most obvious disagreement would be if the
5


 Previous Page
