the concentration reported by NET Pacific, Inc.
that both QC and QA laboratories follow the same
(Fig. 12), the correlation was significant at the
extraction and analysis procedures. Finally, we rec-
99.8% probability level. The fitted linear equation
ommend stopping the dual use of laboratories
indicates no bias (log ratio = 0.0) at a TPH con-
for QA and QC functions.
centration of 5600 ppm. At lower TPH concentra-
tions, CAS, Inc. reports concentrations on sample
Explosives in soils
splits that exceed those reported by NET Pacific,
The 71 data reports for explosives in soils sub-
Inc., and the difference increases as concentration
mitted by the MRD contained a total of 65 pairs
decreases. For example, when NET Pacific, Inc.
with both QC and QA as real numbers. The dis-
reports a TPH concentration of 100 ppm, CAS,
tribution of these pairs among several analytes is
Inc. reports, on average, a concentration of 200
shown in Table B6. The MRD, Omaha, Nebraska,
ppm. Bias of this magnitude is unacceptable. Be-
laboratory served the QA function in all of these
cause of the numerous laboratories used to ana-
results. Seven of the 65 pairs (10.8%) yielded QC/
lyze samples, this problem is magnified several
QA ratios outside 0.254.00. However, clustering
times. In the case of the NPD results, the 43 ratios
around the ideal ratio of 1.00 was much better
not shown in Figure 12 contained results from
than for VOCs or TPH; 72% were between 0.50
five other laboratories.
2.00. Bias was suggested because 41 of the 65 ra-
One possible way to identify the source of bias
tios were less than 1.00. Since there was no ap-
and, hopefully, to eliminate it, is to prepare sev-
parent distinction in the distributions or geometric
eral typical soils fortified with known concentra-
means of the ratios for individual analytes, they
tions of TPH. To minimize potential error sources
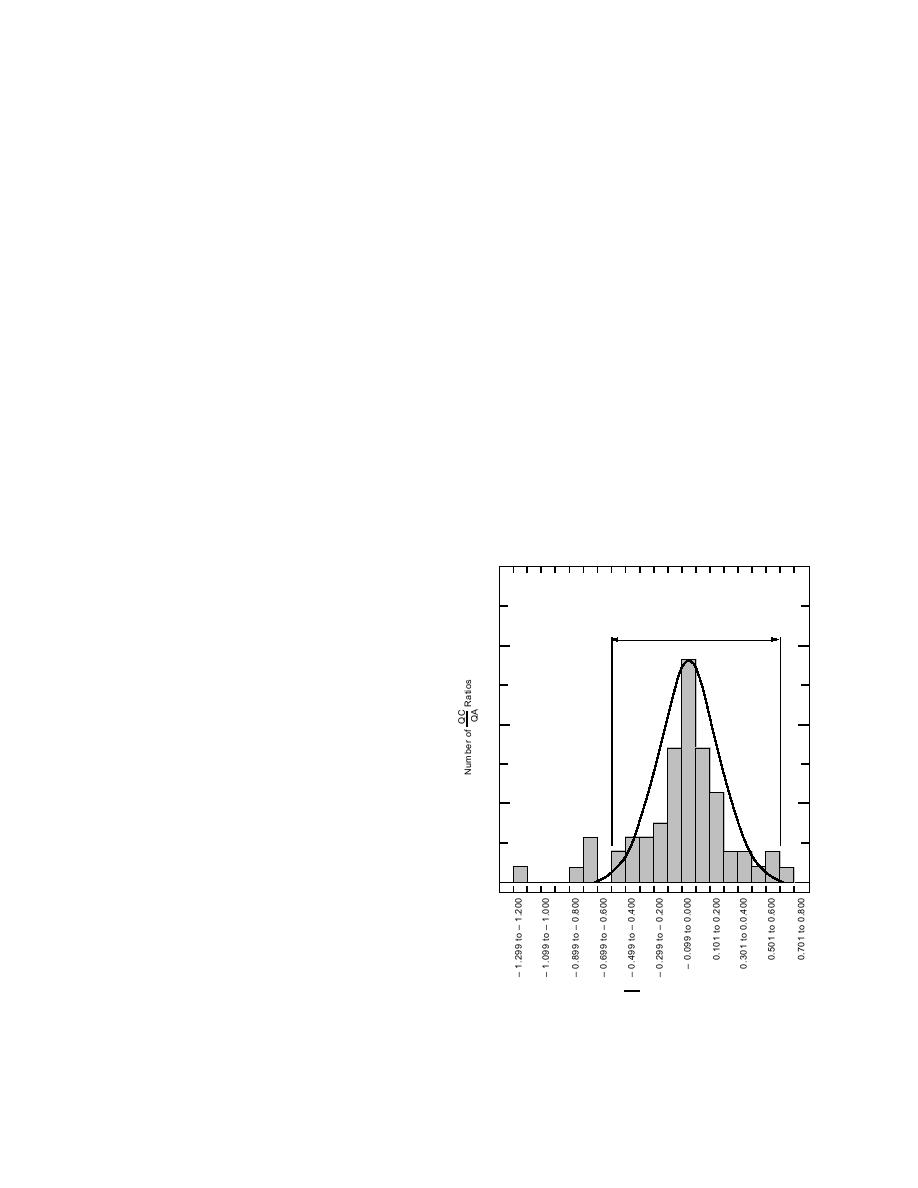
were treated as a single group. Figures 13 and 14
such as volatilization and biodegradation, we sug-
show a histogram and a probability plot, respec-
gest weighing portions of homogenized dry soils
tively, for the logs of the 58 ratios between 0.25
into ampoules. Each ampoule would be spiked
4.00. The lognormal model once again provides a
with a known amount of TPH and sealed as de-
reasonable fit.
scribed by Hewitt (1994). Perhaps three soils with
different clay and organic matter content could
20
be used. After participating laboratories analyzed
these secondary standards and submitted the re-
sults for statistical analysis, a general meeting
could be held to resolve causes of large differ-
Boundaries Corresponding to
Ratios of 0.25 to 4.00
ences. Ideally the number of participating labo-
15
ratories would be minimized. Unfortunately,
there is no obvious way to compensate for the
effects of variable degrees of weathering, and
that may prove to be one of the largest sources
10
of error.
In summary, we think it is inappropriate to
suggest acceptability limits until the method as
currently practiced is brought under better con-
trol. If temporary limits are desired for the in-
5
terim, we feel they should be no wider than 0.25
4.00. When these limits were used for the most
recent results for 87 samples from 15 project lo-
cations, 5.5% of the QC1/QC2 ratios and 16% of
0
the QC/QA ratios were outside of these limits.
These results agree well with the 6.0% and 14%
estimates obtained for archived NPD data.
As soon as possible, secondary TPH standards
should be prepared for use in a study to define
and minimize bias. Such standards could also
QC
Logs of
Concentration Ratios
QA
become part of the routine QC program. A study
Figure 13. Frequency histogram for soil explosives
of sampling, sample splitting, and storage should
QC/QA concentration ratios from MRD.
also be conducted. It is also important to ensure
15


 Previous Page
