

30
Boundaries Corresponding to
Ratios of 0.25 to 4.00
99
98
20
95
90
70
10
50
30
0
10
5
2
1
0.1
1.0
5.0
QC1
QC
Logs of
Concentration Ratios
TPH
Concentration Ratios
QC2
QA
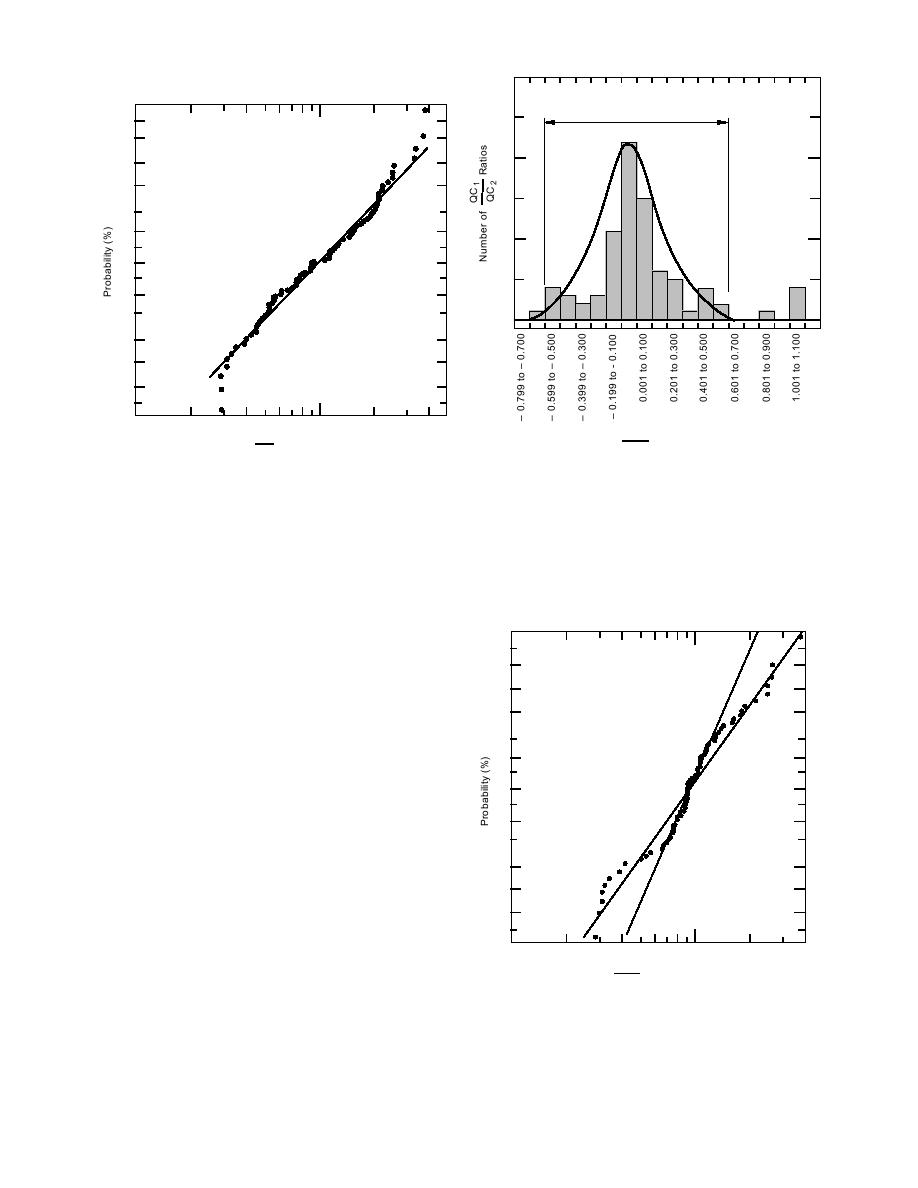
Figure 9. Lognormal probability plot for soil TPH QC/QA
concentration ratios between 0.25 and 4.00 for NPD results.
concentration ratios from NPD.
these ratios on lognormal paper (Fig. 9). How-
0.224.07, which is in good agreement with the
ever, the histogram of ratios for MRD results
arbitrary limits used to edit the data. The geo-
shows extreme dispersion, and the values between
metric mean of the 82 QC/QA ratios between
0.254.00 form a rectangular distribution, thereby
0.254.00 was 0.98 with 95% confidence limits of
precluding statistical analysis using a lognormal
0.841.15 and 99% tolerance intervals of 0.166.15.
model. The NPD results were probably more reli-
able than the MRD results because the former
99
tried to ensure that both QC and QA laboratories
98
used the same state-approved method. There is a
95
wide variation in both the extraction and analysis
procedures for TPH as a function of various state
90
requirements. We chose to analyze only the more
reliable NPD results; no further analysis was con-
70
ducted on the MRD results. This decision was
rooted in the conviction that future aspirations
50
should at least be based on the best of past per-
formances.
30
A histogram of the log QC1/QC2 results is
shown in Figure 10 and the lognormal probabil-
10
ity plot appears in Figure 11. Both plots provide
5
only fair fits to the lognormal model and there is
some uncertainty about the correct location of the
2
straight line in Figure 11. Nonetheless, the expec-
1
tation of lognormality and the absence of a better
0.1
1.0
4.0
model convinced us to proceed with this model.
QC1
TPH
Concentration Ratios
QC2
The geometric mean of the 78 QC1/QC2 ratios
between 0.254.00 was 0.95 and 95% confidence
Figure 11. Lognormal probability plot for soil TPH
limits on this mean were 0.841.07 (Table B5). The
QC1/QC2 concentration ratios between 0.25 and 4.00
99% tolerance intervals for individual ratios were
for NPD results.
13

 Previous Page
