The original plan called for reporting limits to
able values seems reasonable, and the 0.502.00
be specified on all data reports for all analytes.
range of ratios is recommended for duplicate QC
However, many data reports showed either no
samples. Incidentally, for the other four metals
reporting limits or only a few. The lack of com-
with few values above reporting limits, all ratios
plete data limited the comparisons of reporting
(12 Cd, 5 Hg, 1 Ag) were within this recommended
limits to some extent.
range. When this range was used to analyze the
For VOCs in groundwater concentrations, nu-
most recent results from 104 samples (32 project
merical surrogate recovery results were sparse.
locations), only 2% of the QC1/QC2 ratios were
Often nothing was specified or the recoveries were
outside of these boundaries.
simply labeled "OK." We had planned to use this
As expected, the QC/QA ratios were less re-
information to aid in identifying outliers (unac-
producible than the duplicate QC ratios. In Table
ceptable results), but too little data were present
B1 we note that 29 values (6.3%) were designated
to permit this application.
outliers because they fell outside of 0.303.00.
A few values were flagged with "J" to desig-
These 29 outliers are well distributed among the
nate that the value was estimated (below the re-
four metals, As, Ba, Cr, and Pb. The distribution
porting limit). However, these values yielded ra-
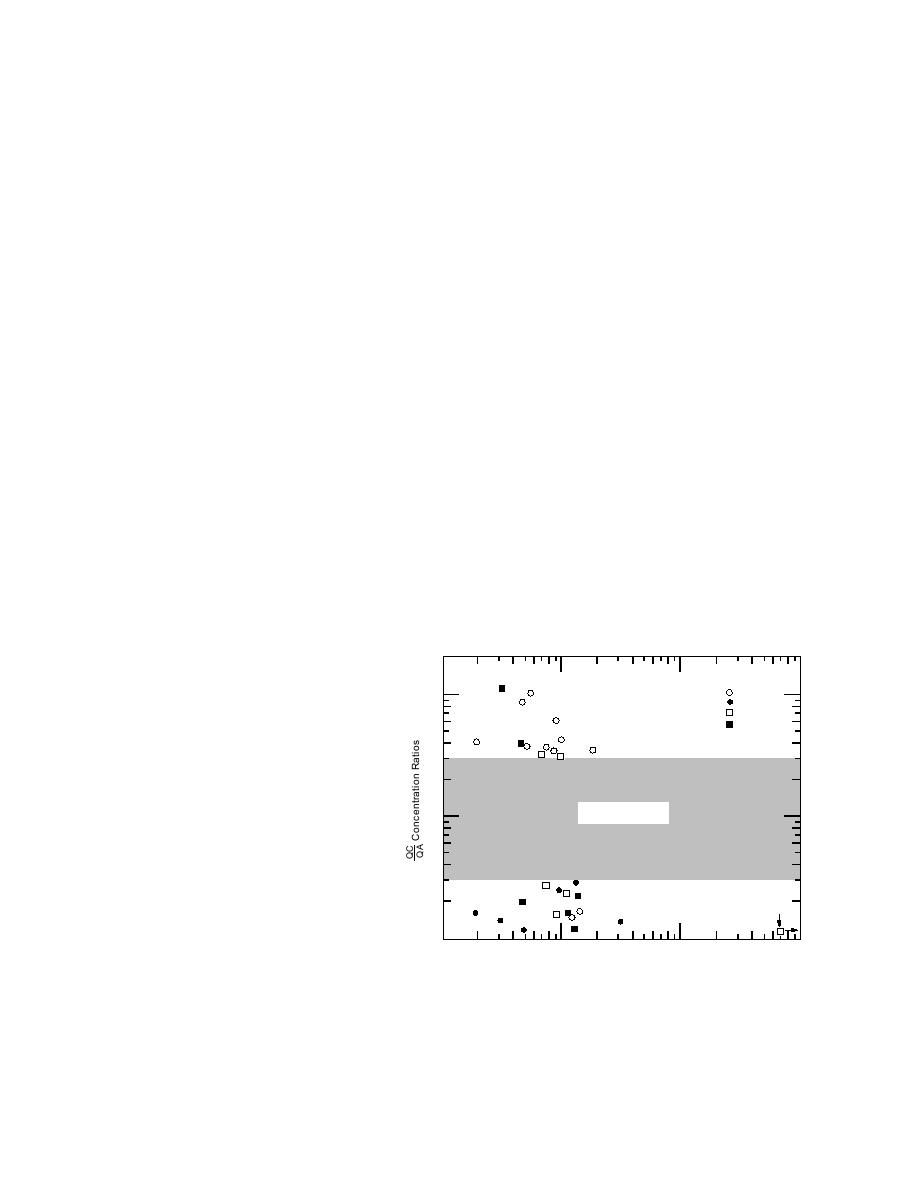
of outliers relative to QA concentrations is shown
tios that appeared to be about as reliable as the
in Figure 3. In order to plot results from four met-
bulk of the results and, therefore, they were used
als with very different concentration means, the
in the comparison.
QA concentration for each outlier was normal-
ized to the mean QA concentration for that metal.
Log-log scales were necessary to accommodate
the wide ranges of values. Although there are a
RESULTS AND DISCUSSION
few more ratios below 0.30 than above 3.00 (16
The discussion that follows is based on the as-
vs. 13) and more ratios for concentrations below
sumption that the lognormal model is adequate
the normalized mean QA concentration of 1.00
for these sets of ratios. The null hypothesis then
than above (19 vs. 10), there is little basis to sug-
is that geometric means of the ratios have an ex-
gest that outliers occur primarily in extreme con-
pected value of 1.00 and that 95% confidence lim-
centration regions. In fact, most of the outliers
fall between one-half and two times the mean
its based on logs should bracket 1.00 if there is no
concentrations. For the 23 ratios available for Cd,
bias between the QC and the QA laboratories.
Hg, and Se, three were outliers (all on the high
Furthermore, 99% tolerance intervals based on
similar assumptions should include
nearly all individual ratios. Any ratios
that fall outside of the tolerance limits
As
should be flagged for further review.
10
Ba
Cr
Pb
Metals in soils
Results for As, Ba, Cr, and Pb are
summarized in Table B1. We see that
only 1.3% of the duplicate QC ratios
were outside the arbitrarily chosen 0.30
Range of
1.0
Acceptable Values
3.00 range for classification as outliers.
For Ba, Cr, and Pb, the expected mean
ratio of 1.00 was bracketed by the 95%
confidence limits, but the lower limit for
As was slightly above 1.00, suggesting
a slight bias. The 99% tolerance limits
were all very similar, with only six val-
0.10
ues outside these boundaries. If we
0.10
1.0
10
100
Normalized (to means) QA Concentrations
choose 0.502.00 as the regulatory lim-
Figure 3. Distribution of soil As, Ba, Cr, and Pb QC/QA concen-
its for all four metals, the outlying Pb
tration ratios outside the acceptable range of 0.303.00 as a func-
ratio is within tolerances and the total
tion of QA concentrations normalized to their respective mean
number of excluded ratios is 8(3+5), or
concentrations.
3.4%. This small percentage of unaccept-
6


 Previous Page
