charges per thousand intermolecular distances along
pected. This should increase the estimated upper limit
of qa/e somewhat.
the dislocation core. This charge magnitude was esti-
We can conclude that there is no significant discrep-
mated as a lower limit because of the use of blocking
ancy among different authors and the techniques
(non-ohmic) electrodes, so that the charge flow within
applied and that most probably the magnitude of qa/e
the ice produced polarization at the surface and the full
should be somewhere in the range from 2 103 to 2
current may not be recorded by the electrometer.
102. If the above-described accumulation of point de-
fects in the region of tension near a dislocation core is
Motion of charged dislocations
responsible for the dislocation charge, then the small
in an electrical field
linear density of this charge does not reflect the real
Itagaki (1970) used a different technique to deter-
mine the dislocation charge density q. Using X-ray to-
number of the defects captured, but rather shows a dif-
ference in concentrations of positive and negative
pography to observe dislocation lines in ice, he found
defects near the dislocation.
that some dislocations vibrated when an external ac
electrical field was applied. At the low-frequency limit,
the amplitude of vibrations η depends only on the
Effect of static electrical field on ice creep
In ionic crystals and some semiconductors, qa/e is
length of a dislocation segment ld, external electrical
field E and the tension of a dislocation line Td. Namely
so large (0.11.0) that the application of high external
electrical fields of E ≈ 104 V/cm is able to accelerate or
r
l2 ⋅ E ⋅ q
η=
halt creep, depending on the relative directions of qE
.
(55)
8Td
and the predominant velocity of dislocations (Whit-
worth 1975, Osip'yan et al. 1986). Such an effect of
This equation enables us to estimate q if l, η and E are
electrical fields on plastic deformation in ice has not
known.
been observed so far. However, the application of even
Itagaki measured the amplitudes of vibrations η in
smaller static electrical fields of 103 V/cm can signifi-
pure single crystals of ice taken from the Mendenhall
cantly suppress plastic creep of thin ice specimens hav-
glacier. The ac field strength ranged from 3 to 600
ing a thickness of 1 mm or less (Petrenko and Schulson
V/cm, and three frequencies of 60, 1.33 and 0.33 Hz
1993).
were used. The linear density of a dislocation charge
We examined the effect of dc and ac electrical fields
estimated by Itagaki ranged from qa/e = 3.6 103 to
on the plastic deformation of pure and doped (with HF
qa/e = 2 102.
and KOH) single crystals of ice in the temperature
Later, Joncich et al. (1978) tried to explore a similar
range of 10 to 45C. The basal plane (0001) was a
idea to estimate q for dislocations. They applied a
slip plane for dislocations. We found that a relatively
strong electrical field across a low-angle title boundary
small (about 1050 V) dc voltage applied across thin
consisting of edge dislocations. Their tests were per-
single crystals decreased both the creep strain rate ε
˙
formed at T = 15C. No measurable displacement of
the boundary was observed. Based on their experi-
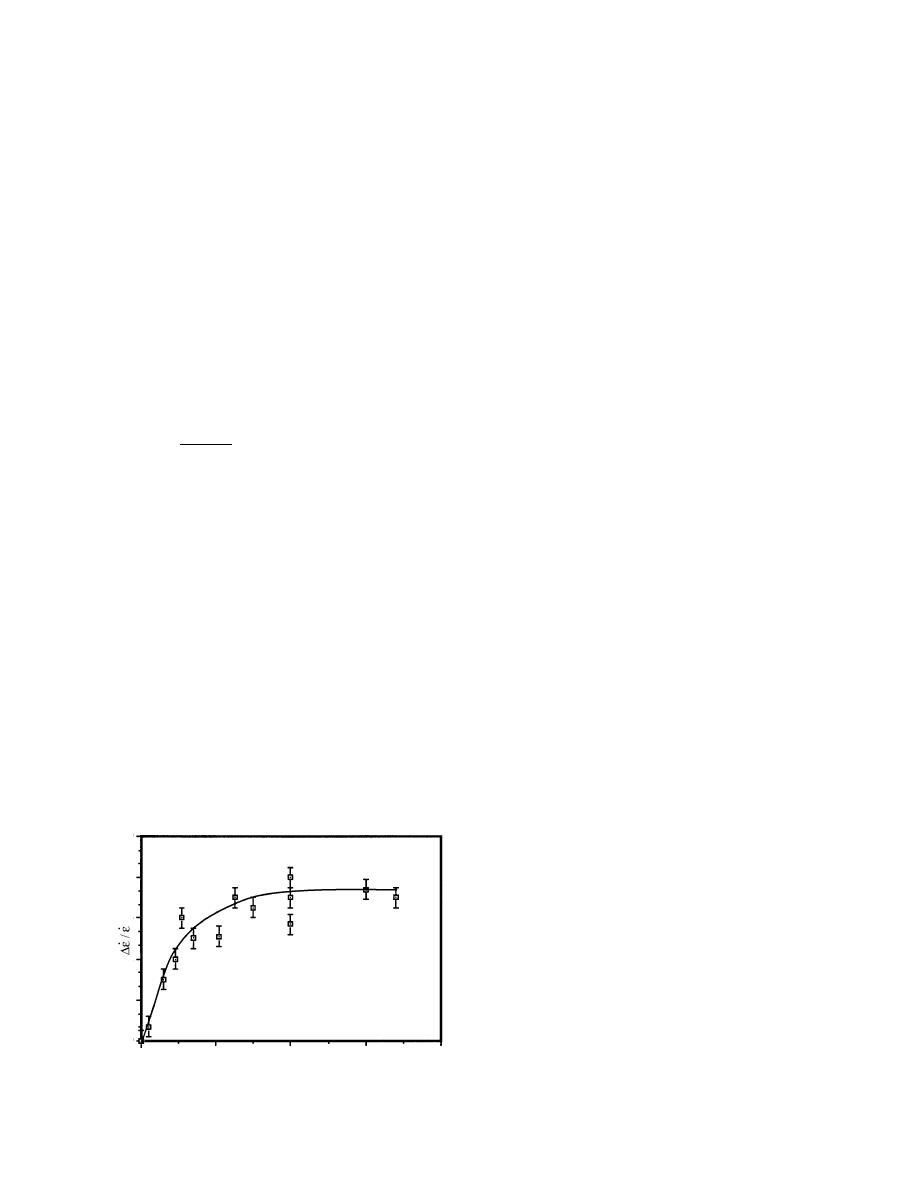
36 depicts the dependence of the creep strain rate on the
mental precision, Joncich et al. concluded that qa/e
dc voltage applied to a 50-m thick ice specimen. At
cannot exceed 3.3 103. Since they used a dc electri-
the same time, the application of an ac electrical field of
cal field and blocking electrode, the real E in the ice
the same strength as the dc field or the application of a
bulk in their experiment could be lower than they ex-
dc field to thick specimens (13 mm) did not reveal
changes in the creep rate. We felt that the observed
changes in the plastic deformation were ascribable to a
decrease in the concentrations of Bjerrum defects
caused by the strong static electrical fields. The con-
centration of Bjerrum defects is proportional to σ∞ and
can be easily monitored.
Figure 36. Dependence of the relative change in strain
rate ε on the applied dc voltage V (after Petrenko and
˙
Schulson 1993). ε is the strain rate at V = 0. T = 20C,
˙
0
100
200
300
400
sample thickness L = 50 m.
V
25


 Previous Page
