360
Jam Releases
300
240
180
Daily Average Flow = 140 m3/s
120
Jam Forming
(0700 hr)
60
0
6
12
18
6
12
18
6
12
18
March 10
March 11
March 12
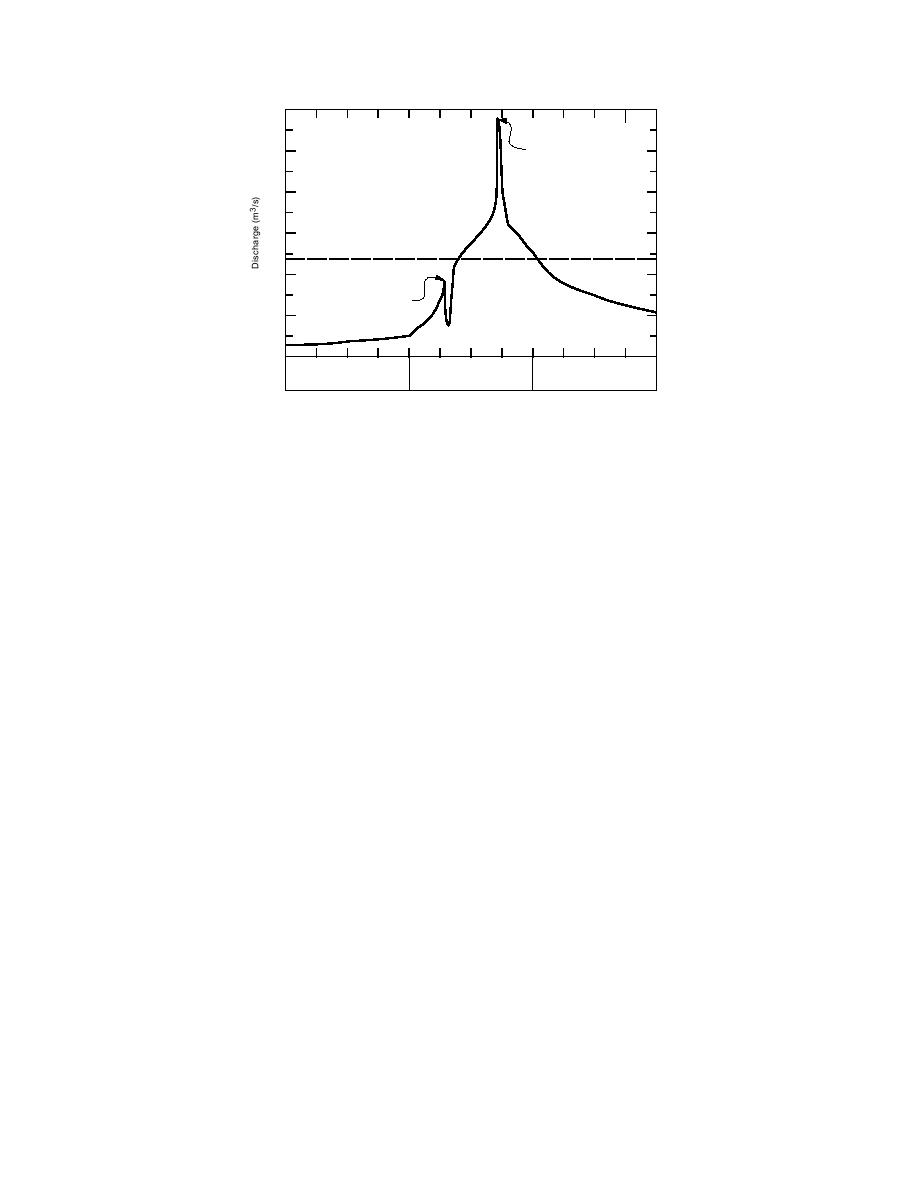
Figure 54. Discharge record during breakup jam initiation and failure.
discharge at upstream locations, however, could be markedly different from that
recorded at the gauge. In many cases, gauges are not located near the jammed reach
and estimates of discharge become difficult. In some situations, a jam may create a
backwater effect on the measuring gauge, and interpretation of the stage recording
(in developing the discharge record) also becomes questionable. Winter discharge
estimates can be off by as much as 25% because of backwater from ice jams. As a
result, the choice of discharge used in a steady-state model can greatly affect the
results of the modeling.
The fully coupled model was used, in conjunction with the static-unsteady thick-
ness model with a constant discharge, to determine how the choice of water dis-
charge affects jam thickness profile. Figure 55 shows a hypothetical breakup jam
discharge hydrograph. The hydrograph is characterized by a fast rise and very
short duration peak, similar to the hydrograph depicted in Figure 54. While the
fully coupled model uses this hydrograph as an upstream boundary condition, a
steady-state model requires that a single discharge be chosen as an input variable.
One choice might be the peak value of discharge. If the modeled system were of
significant length, however, the instantaneous peak would be attenuated as it trav-
eled downstream. Thus, the discharge felt at downstream locations (and conse-
quently shear stress on the underside of the jam) would be less.
Another choice for the steady-state discharge might be a time-averaged discharge
based on the time required for a disturbance to pass through the system. Two tests
were run with the static-unsteady thickness model at a constant discharge level
and corresponding uniform values of depth and water velocity. This simulated the
calculations of a steady-state model: one with a constant discharge of the peak
value of 200 m3/s from Figure 55 and the other with a time-averaged constant
discharge value of 167 m3/s.
Figure 56 shows the final jam thickness profiles for these two runs, along with
the final jam thickness profile predicted using the fully coupled model with the
unsteady discharge hydrograph. The steady discharge levels and uniform initial
conditions result in uniform jam thickness equal to that given by the equilibrium
jam formulation represented by eq 25. The fully coupled thickness profile is greater
than the equilibrium thickness for both of the steady discharge choices everywhere,
70


 Previous Page
