2.0
1.6
Large
1.6
1.4
η
0.00005
η eq
Medium
η
0.00008
η eq
0.00010
0.00025
1.2
1.2
0.00050
Small
0.00075
0.00100
0.00250
0.8
0
1000
2000
3000
4000
5000
1.0
0.5
0
1.0
1.5
2.0
x Location (m)
a ∆Q
( c )( Q )
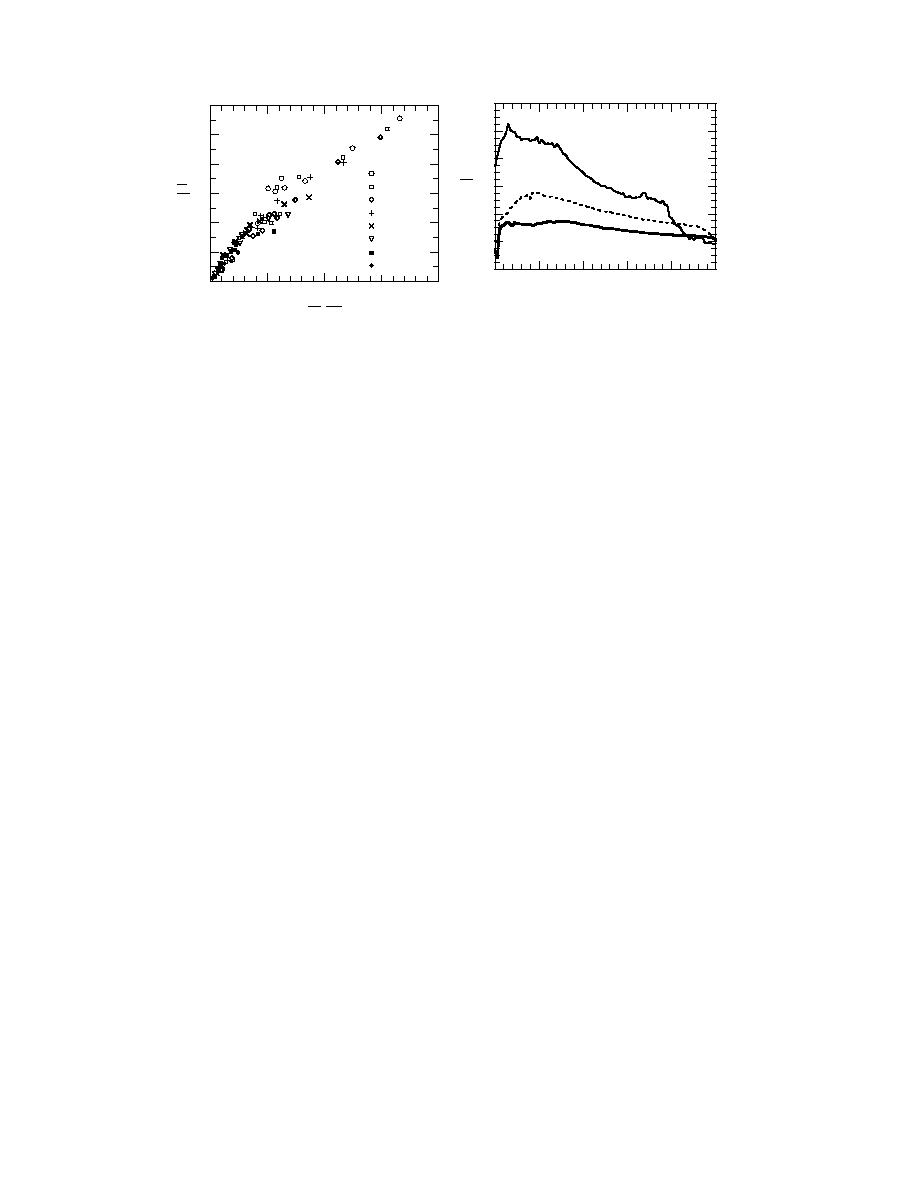
Figure 58. Dimensionless jam thickness vs.
Figure 59. Final jam thickness profiles for
ice momentum parameter for several bed
large, medium, and small ice momentum
slopes.
effects.
A curve such as the one presented in Figure 58 could be used to determine the
general effects of ice momentum on predicted changes in water discharge. A few
simple calculations would allow a determination of whether a static, steady flow
model is satisfactory or if a fully coupled model such as the one presented here is
required to provide accurate jam thickness, and thus water surface, profiles.
Effects of hydrograph shape on jam thickening
The experiments discussed in the previous section show that the relative state of
initial stability of a jam, in conjunction with the relative change in water discharge
expected, determines whether ice momentum significantly affects jam thickness
profile. Other factors may also determine when ice momentum is significant. Field
observations have shown, in general terms, that fast rises in discharge because of
heavy rain on frozen ground often result in severe ice jams producing devastating
flooding. Commensurably, gradual warming trends with slower discharge increases
and higher air temperatures, which cause the jam strength to weaken, often result
in less dynamic or damaging jams. The experiments discussed in the Laboratory
Experiments section attempted to simulate short duration peak flow events by in-
creasing the water discharge and then decreasing it again after a short period. The
effect of these short duration peak flows was to stall the progression of the shoving
and thickening, resulting in only partially thickened jams. For those cases, the ice
momentum may be important, but the peak discharge may be attenuated greatly
by the time the disturbance travels the length of the entire system.
A series of experiments was conducted to assess the effects of the shape of the
inflow hydrograph on the resulting jam thickness profile and to establish whether
ice momentum continues to be a consideration in these cases. Runs were made
with various rates of rise on the rising limb of the hydrograph. The baseline runs
had a rate of rise of 2.5 m3/s for each time step of 0.5 minutes. For these runs, the
time step was held constant, but the boundary condition file describing the inflow
hydrograph was modified for rise rates of between 10 and 0.3125 m3/s for the same
0.5-minute time step. This modification resulted in times to peak tp (time for the
hydrograph to increase from 100 to 200 m3/s) of 5, 10, 20, 40, 80, and 160 minutes.
The inflow hydrographs are shown in Figure 60. Time to peak tp was related to the
base time tb defined as the time taken for a disturbance to travel the length of the
simulated channel. From eq 152
74


 Previous Page
