L
L
tb = T = T
240
(156)
c
gd
200
where LT is the total length of the mod-
eled system. Runs were made for the
160
values of tp given above and three dif-
5 min
10
ferent bed slopes--0.00005, 0.0005, and
20
40
0.001. A functional relationship between
120
80
the ratio of average final jam thickness
160
80
0
100
200
300
400
500
600
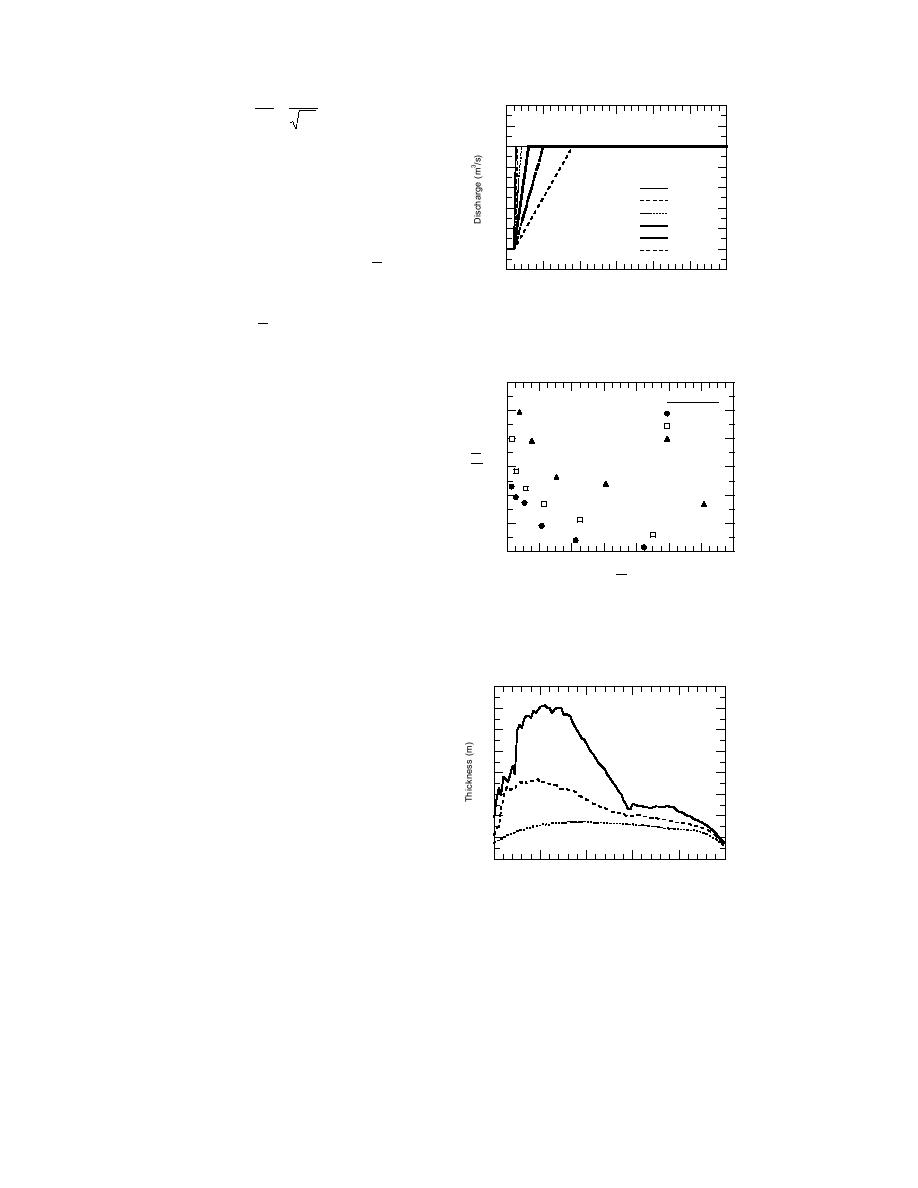
tp/ tb is evident in Figure 61. As the time
Time (min)
to peak tp increases, the average final jam
Figure 60. Inflow hydrographs for various
thickness η approaches that predicted
times to peak.
by equilibrium theory ηeq. The effects of
tp on the shape of the final jam thickness
1.6
profile is demonstrated in Figure 62,
Bed Slopes
which shows the final profiles for times
0.00100
to peak of 5, 20 (standard), and 80 min-
0.00050
0.00005
1.4
utes for the bed slope of 0.0005. As tp
η
decreases, the changes in water dis-
η eq
charge for each time step increase, result-
1.2
ing in larger gradients of the variables
in the upstream reaches. The gradient
terms (e.g., η/ x ) are not included in
1.0
the equilibrium thickness formulation of
0
4
tb 8
12
eq 25 and play an important part in the
tp
full ice momentum equation. Also, the
Figure 61. Dimensionless jam thickness vs.
large changes in water discharge easily
tp/tb at three bed slopes.
overpower the stability of the jam, result-
ing in significant ice velocities and ice
momentum effects.
3.2
Experiments were also conducted to
investigate the effects of the sustained
2.8
time at the peak flow ts. For these runs,
5 min
the standard inflow hydrograph rate of
rise of 2.5 m3/s increase per time step
2.4
20
was used, but the time at which the wa-
ter flow was held at 200 m3/s, before be-
2.0
80
ing reduced back to the initial value of
100 m3/s, was varied. The sustained
1.6
0
1000
2000
3000
4000
5000
times simulated were 0 (instantaneous
x Location (m)
peak), 10, 20, 40, 80, and ∞ minutes (no
Figure 62. Effect of tp on final jam thick-
discharge decrease) as shown in the in-
ness profile shape.
flow hydrographs depicted in Figure 63.
These runs were conducted at the same
three bed slopes as above.
Figure 64 shows relationships between the ratio of final average thickness to
nal value of ts/tb (beyond which there were no changes in jam thickness) was cho-
sen for plotting purposes. Again, the effect of bed slope is clearly seen. It is signifi-
cant that, as the value of ts/tb reaches 1, the effects of further increases in the
75


 Previous Page
