240
except the most downstream reaches.
The effects of ice momentum and
200
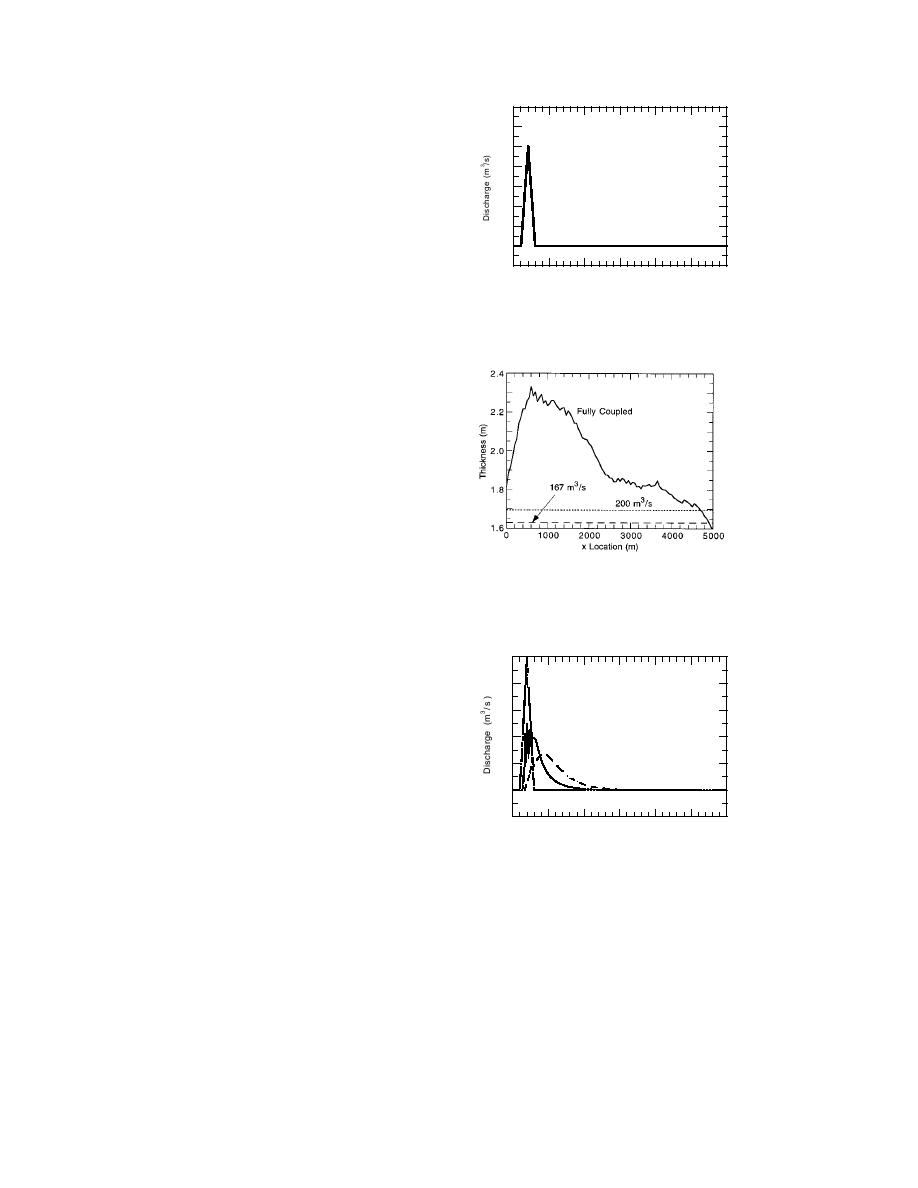
nonuniformities in depth and thickness
on the fully coupled profile are clearly
160
evident, even for this discharge
hydrograph with a very short duration
120
peak. The smaller thicknesses at the
downstream end are ascribable to at-
80
tenuation of the peak flow as it travels
0
100
200
300
400
500
600
Time (min)
downstream. Figure 57 shows the dis-
Figure 55. Hypothetical breakup jam dis-
charge hydrograph at the upstream
charge hydrograph.
boundary, the midpoint of the modeled
system, and the downstream boundary.
The peak flow is greatly reduced as it
travels downstream, with a maximum
value less than 150 m3/s by the time it
reaches the midpoint of the modeled
system. The wave is also significantly
flattened. The high-frequency fluctua-
tions in discharge at the mipoint come
from ice movement. As the ice moves
and stops, resistance to water flow var-
ies, resulting in local fluctuations in wa-
ter discharge.
Figure 56. Final jam thickness profiles for
two steady water discharges compared to
Dimensionless momentum parameter
the fully coupled model results.
The numerical experiments show that
ice momentum is important in the pre-
200
diction of jam thickness. Its effect can be
a large one, not only in the magnitude
Upstream
of the thickness as compared to that pre-
160
dicted by equilibrium theory, but also in
the nonuniform shape of the thickness
Mid-reach
profile. Some of the experiments show,
120
Downstream
however, that, for small changes in the
discharge or for initial conditions of jam
thickness that are slightly less than equi-
80
0
100
200
300
400
500
600
librium thickness associated with the ex-
Time (min)
pected flow levels (e.g., those presented
Figure 57. Water discharge at upstream
in the Model Rigor section), ice momen-
end, mid-reach, and downstream end of
tum has a negligibly small effect.
the system.
For example, the final jam thickness
profile in Figure 42 is within 10% of the
equilibrium thickness value for that water flow rate, for the jam with an initial
thickness of 1.3 m. The average jam thickness, however, is 1.5 m or 2% above the
equilibrium value. For this case, a steady-state equilibrium thickness calculation
would have proved satisfactory. When unsteady boundary condition data are not
available, it may be necessary to use a simpler steady-state model to provide jam
thickness estimates, rather than using the fully coupled unsteady model. There-
fore, it is useful to identify a parameter, or set of parameters, that indicate when ice
71


 Previous Page
