8
the upstream reaches thickened to over
2.0 m. The initial jam thickness profile for
Final WSL
this test was specified as a uniform 1.5 m.
6
Initial WSL
Given the water surface profile that
was specified as the initial conditions, the
4
initial stable jam thickness would have
Initial Ice Bottom
been less in the downstream reaches. This
2
Final Ice Bottom
may have resulted in significant shoving
Bed
and thickening in those areas, leading to
0
a totally different final jam thickness pro-
0
1000
2000
3000
4000
5000
x Location (m)
file.
Figure 47. Final bed, bottom of jam, and
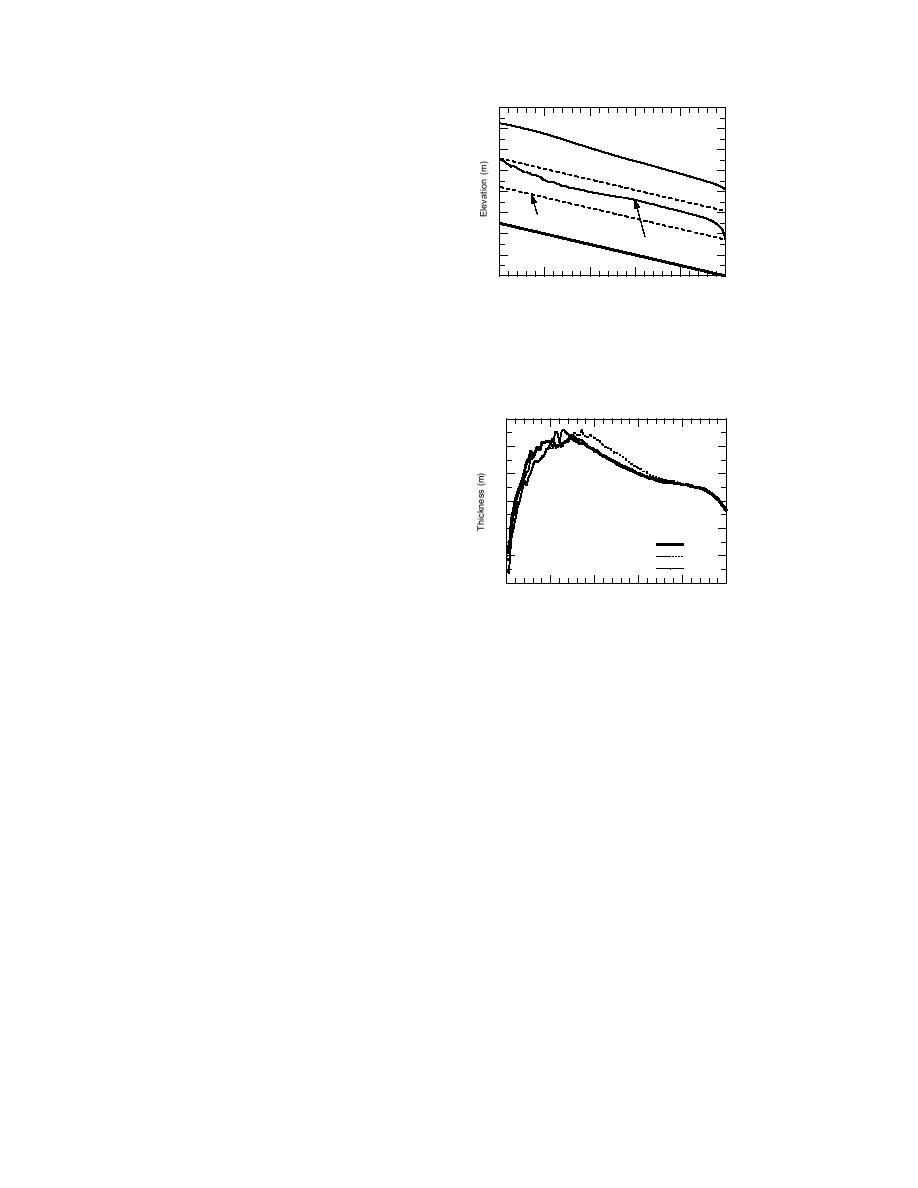
For another run, the downstream
water-surface level profiles for the condi-
depth was held at the initial uniform
tion of downstream depth being held at an
depth of 1.729 m. All the other conditions
initial depth of 1.729 m.
were the same as the baseline run. Fig-
ure 47 shows profiles of the bed, bottom
2244
..
of jam, and water-surface level for this
run. Confining the downstream depth
2222
..
required that the water velocity increase,
220
.
which resulted in significant thickening
and water-surface level rises. This figure
1188
..
shows that the profiles of the water sur-
1166
..
face and jam bottom at the downstream
1.47 m
1144
..
1.40 m
end are very similar to the classical
1.30 m
downstream transition configuration of
1122
..
0
1000
2000
3000
4000
5000
an idealized ice jam (e.g., Ashton 1986).
x Location (m)
Several other runs were made using a
Figure 48. Final jam thickness profiles for
specified jam thickness as the upstream
upstream jam thickness being held at 1.47,
boundary condition. Three runs with jam
1.4, and 1.3 m.
thicknesses held at 1.47, 1.4, and 1.3 m at
the upstream end were compared to the
baseline run (equilibrium jam thickness at the upstream end). Figure 48 shows the
final jam thickness profiles for these runs. The profiles are very similar, with differ-
ences primarily occurring in the most upstream 1000 m. The implicit nature of the
numerical solution procedure extends the effect of the specified (artificially low)
jam thickness for several computational steps downstream. Also evident from the
figure is that the progression of the shoving and thickening differs in each run,
resulting in slightly different jam thickness profiles. It would be expected that a
locally weak reach would shove and thicken first, setting up changes in the water
depth and velocity (since the solution is fully coupled). Minor changes in the water
variables translate into minor changes in the ice variables and in the final, stable
jam thickness profiles.
Effects of variable length steps
Final testing of the model involved examining the effects on the predicted
results of variable computational length steps. The finite-difference formulation
allows variable length steps, whereas other computation methods do not without
considerable difficulties (i.e., the Method of Characteristics). This facility is needed
because field data are often variable in the distance between cross sections. While
the computational effects of variable length steps should be minimal, care must be
65


 Previous Page
