Table 2. Strength predictions of Labrador iceberg ice.
types of iceberg ice and freshwater randomly ori-
ented polycrystalline ice in a multiaxial stress state.
Confining
Strain
θ
σ1 - σ3 (MPa)
rate ε
˙
pressure
(C) (MPa)
(s1)
Measured Predicted
Ice type
STRENGTH PREDICTIONS
4.82 105
11
1.38
3.50
4.36
Labrador ice
5.96 105
11
6.89
4.75
4.93
Labrador ice
Let us verify the accuracy of strength predic-
tion by comparing the computed and the test re-
sults of ice strength as functions of temperature,
ε 1/n
strain rate and hydrostatic pressure.
˙
σ1 - σ 3 = 3 (c + bp)
.
(25a)
For low hydrostatic pressures p << σmax and
εo
˙
the strain rate ε = εo , ice strength can be calcu-
˙˙
lated by eq 9 using data of Table 1 and the hydro-
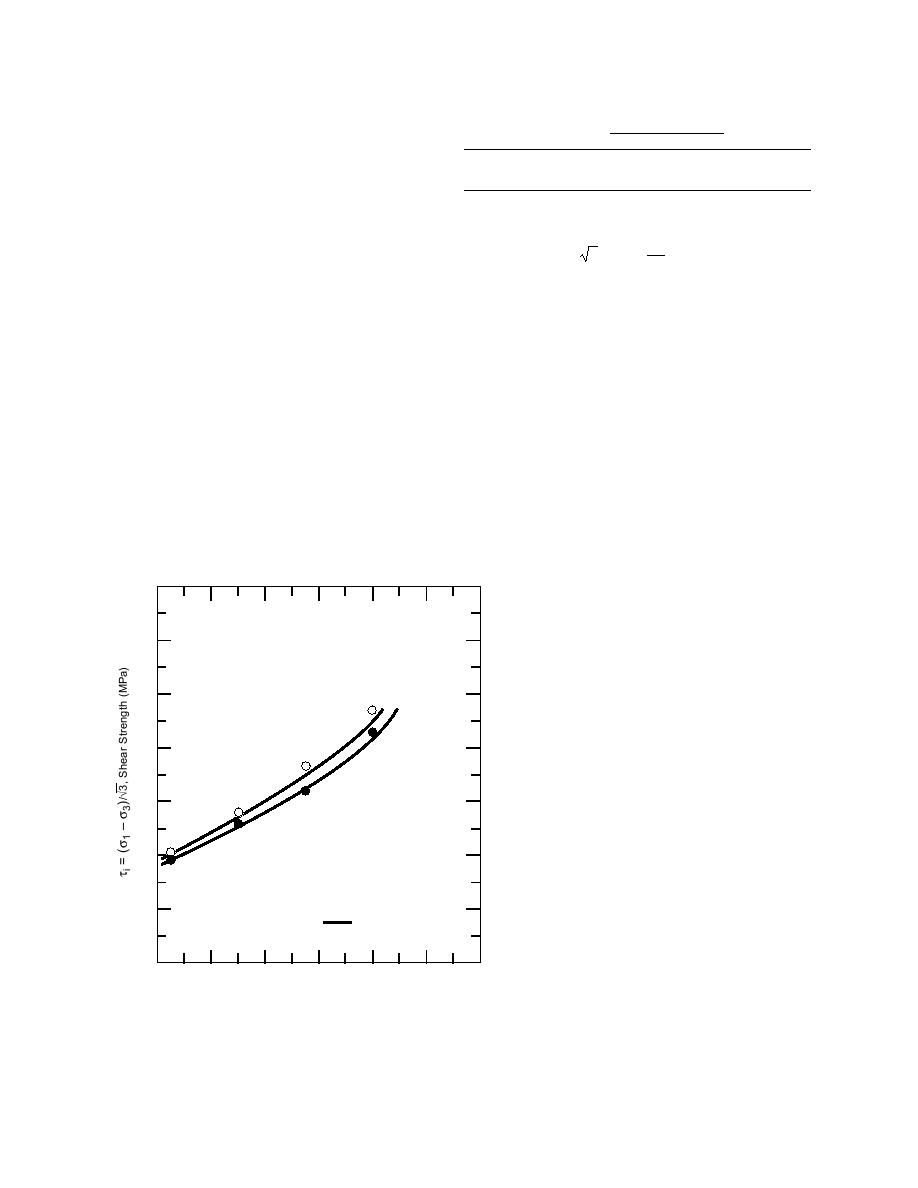
In Table 2 the results of such calculations are pre-
sented for n = 4, εo = 5 10-3 s-1, two different
static pressure magnitudes p from Figure 3, corre-
˙
sponding to confining pressures σ3 = 1.38 MPa
confining pressures (assuming that p = σ3), and
and 6.89 MPa. The results of such calculations for
two different strain rates together with the test
the temperature range between 1 and 16C are
results from Table 2 of Gagnon and Gammon
presented in Figure 8 together with the test data
(1995).
from Gagnon and Gammon (1995). One can con-
From Table 2 it follows that predicted values of
clude that the predicted ice strength values are in
ice strength practically coincide with the test data.
agreement with the test data.
Unfortunately only two tests of this ice type were
The data in Table 1 can also be used to evaluate
available for comparison.
the ice strength in those cases when the strain rate
In Figure 9 predicted dependencies of the ice
ε < εo . For p << σmax the ice strength is calculated
˙˙
strength are presented calculated by eq 5 using
by eq 25. To simplify the comparison with the
test values of hydrostatic pressures and the
published data, the latter can be rewritten in terms
strength parameters from Table 1. One can see
of deviator stress:
that in the moderate temperature range between
6 and 16C the calculated values of the ice
strength are in good agreement with test data
16
of Gagnon and Gammon (1995). An exception
is the test data for 1C for which the magni-
Labrador Iceberg Ice
----------------------
tude of the ice melting pressure p* = 13.51
14
Data from Gagnon and Gammon (1995)
MPa calculated by eq 14 turned out to be
considerably smaller than p* = 36.85 MPa ob-
tained from the best fit of the experimental
12
points in eq 5. Apparently, as the ice tempera-
ture approaches the ice melting temperature,
σ3 = 6.89 MPa
10
the relationship between the ice melting pres-
sure and temperature becomes nonlinear. Fur-
σ3 = 1.38 MPa
ther studies of the temperature-dependency
8
of the ice melting pressure are obviously nec-
essary.
Equation 5 and the data in Table 1 were
6
used to predict the ice strength over the range
of high hydrostatic pressures. The results of
σ2 = σ3
such an extrapolation are presented in Figure
.
ε ≈ 5 10 3 s 1
4
10 and compared with test data of Jones (1982)
Predicted
for temperature 11.8C, and of Rist and
Murrell (1994) for temperature 40C. In the
2
latter case parameter c was calculated by eq
0
4
8
12
16
20
24
17 to fit the test data, suggesting that further
θ, Temperature (C)
studies of the temperature dependency of ice
Figure 8. Strength of ice as a function of temperature and cohesion in the temperature domain below
20C are required. At the same time the gen-
confining pressure. Data from Gagnon and Gammon (1995).
11


 Previous Page
