Table 1. Strength parameters of ice at various temperatures*.
domly oriented laboratory-made ice
samples were 20 mm in diameter and 60
θC
~ φo σmax (MPa) τmax (MPa)
c (MPa)
b
p* (MPa)
mm long with mean grain diameter less
12.93†
than 1 mm. The test data selected for
40
0.241
14
245.87
43.52
540.54
16
9.43
0.125
7
80.15
14.44
216.22
comparison refer to the axial constant
11.8
8.14
0.106
6
53.81
10.99
159.46
strain rate ε = 5.4 10-3 s-1. The test tem-
˙
11
7.91
0.103
6
49.0
10.43
148.65
perature was 11.8 0.9C. The confin-
430′
6
6.63
0.08
20.05
7.43
81.08
ing pressure (σ2 = σ3) varied between ~5
**
**
(36.85)**
1
5.56
0.053
3
(4.79)
(5.69)
5.37††
0.04††
2††
and ~ 85 MPa.
0
In Figure 10 (below), results of triaxial
* Data in this table for strain rate ε ≈ 5 10-3 s-1.
˙
constant strain rate compression tests
† Calculated by eq 17.
are presented of freshwater, randomly
** From the best fit of eq 5.
†† At freezing.
oriented, polycrystalline ice carried out
by Rist and Murrell (1994). In these tests
are indeed nonlinear and can be described by eq
laboratory-made samples of ice were 40 mm in
18a and 22a. The evaluation procedures of pa-
diameter and 100 mm long. Mean grain diameter
rameters that enter these equations are shown in
was ~ 1.7 mm. The tests were conducted at con-
2 to 105 s1; the test
Figures 5 and 6. It was found that for the Labra-
stant strain rates from 10
temperatures varied between 20 and 45C. The
dor iceberg ice
data selected for this analysis are referred to as
the axial strain rate, ε ~ 10-3 s-1.
˙
co = 5.37 MPa ;
bo = 0.04
α = 9.61 ;
β = 4.69.
PARAMETER EVALUATION
Using these parameters, we calculated the magni-
Temperature variations of ice strength in a mul-
tudes of the ice cohesion c(θ), the friction param-
tiaxial stress state were shown to be defined by
eter b(θ) and the friction angle φ(θ) by eq 18a and
three temperature-dependent parameters: the ice
melting pressure p(T), ice cohesion c(T) and fric-
tion parameter b(T). The magnitudes of
the ice melting pressure p(T) were cal-
16 102
16
culated by eq 14 for the test tempera-
tures and are included in Table 1. The
b (θ)
magnitudes of p* for θ = 11.8C was
found to be in agreement with p* = 123.7
MPa obtained earlier (Fish 1991) from
12
12
the analysis of Jones' data and with that
c (θ)
calculated by an empirical equation of
Hallam and Nadreau (1988).
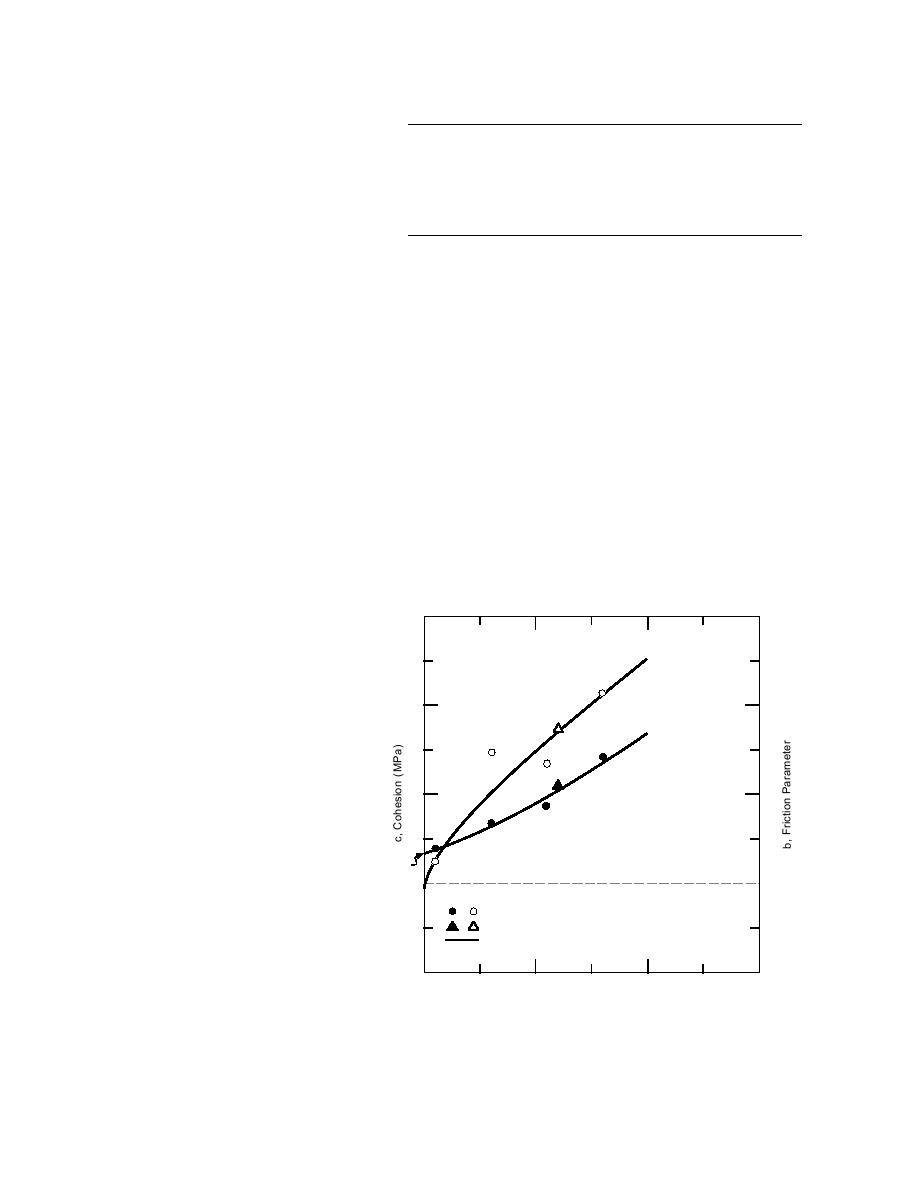
The temperature dependencies of pa-
rameters c(θ) and b(θ) can be determined
8
8
based upon the considerations that in
the range of low hydrostatic pressures p
<< σmax (test pressures in Fig. 3). As a
first approximation, eq 5 can be replaced
c0
b0
by eq 9. Then, the slopes of the straight
4
4
lines and their intersects with the ordi-
Labrador Ice
.
nate axis obtained by a regression analy-
3 1
ε ~ 5 10
Polycrystalline Ice
s
sis of the test data define the magni-
Predicted
tudes of friction parameter b(θ) and
cohesion c(θ) for corresponding tem-
0
0
10
20
30
peratures. The results of the analysis are
θ, Temperature ( C)
presented in Figure 4.
One can see in Figure 4 that tempera- Figure 4. Temperature dependencies of the strength parameters of
ture dependencies of parameters c and b ice. Data from Gagnon and Gammon (1995) and Jones (1982).
8


 Previous Page
