al. (1991) reported that for θ = 10C and for the
10
sliding velocity of 103 m s1, c ≈ 0.13. In Table 1
we found that for 10C, b = 0.098 that is in agree-
ment with the test data.
8
Comparing parameter bo with the kinetic dry
α (Tm T)/Tm
c = c0e
interesting. Since the latter is temperature-depen-
6
dent, the comparison should be made for a low
ice temperature when the effect of the liquid phase
(lubricant) is minimal. Thus, from Casassa et al.
4
(1991) we find that for θ = 35C, d = 0.019,
which is in correlation with bo = 0.04 obtained
above. Obviously a more accurate comparison
2
α/
would require certain adjustments of both pa-
Tm
ln c0
rameters to account for the differences in the test
velocities.
Note that a seeming contradiction may arise
0
4
8
12
16
20
(Tm T ) = |θ |, Temperature (C )
when one compares the ice strength values in
Table 1 with eq 5a. From Table 1 it follows that ice
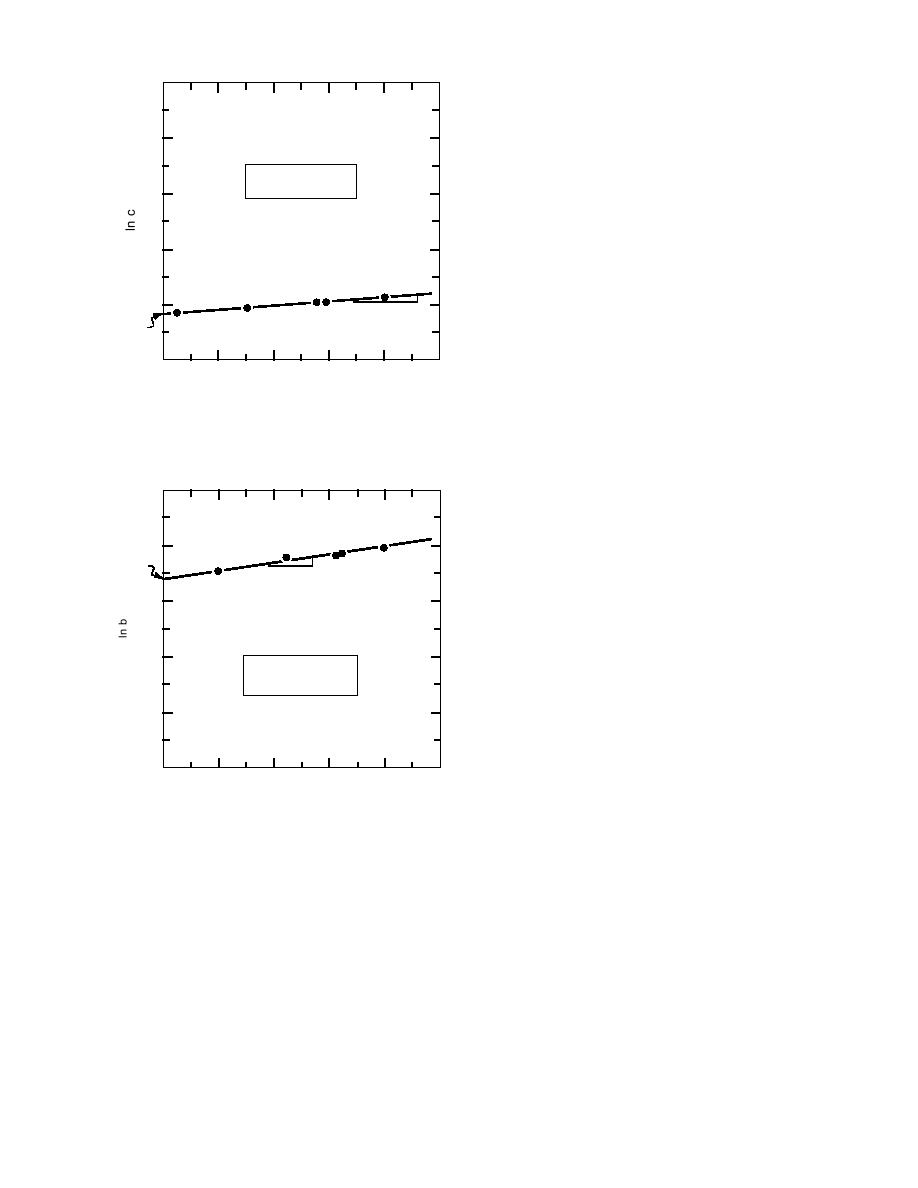
Figure 5. Determination of parameters co and α.
possesses a certain strength at 0C. On the other
hand, from a comparison of eq 5a and 14 one
1/
1/
2
2
= |θ |
concludes that the shear strength of ice at this
(Tm T )
temperature should be zero. Such a contradiction
0
4
8
12
16
20
arises from a peculiar property of ice: ice is formed
and melts at the same temperature, 0C. This con-
tradiction is easily eliminated when one remem-
2
bers that melting of ice (in accordance with eq 5a)
ln b0
will take place over a certain time.
β
β 1 =
1/
Tm2
4
ICE COHESION
6
Ice cohesion is the principal strength param-
1/2
β1 (Tm T)
eter of ice; therefore, it is important to examine
b = b 0e
the relationship of ice cohesion with the other
8
physical characteristics of ice, such as the grain
size, ice structure, etc. Although we have limited
information on the effects of these factors on the
behavior of ice under triaxial compression, some
10
Figure 6. Determination of parameters bo and β.
preliminary conclusions can still be made. Note,
in Figures 4, 5 and 6, test points corresponding to
Jones' (1982) tests on polycrystalline ice with the
τmax(θ) in Table 1 were calculated by eq 6 and 7
grain size of less than 1 mm follow the same
using corresponding values of c(θ), b(θ) and p*(θ).
trends as the test data of Gagnon and Gammon
Predicted temperature dependencies of param-
on the Labrador ice with an average grain size of
eters c and b are presented in Figure 4. From Table
8.1 mm, i.e., eight times larger than the ice in
1 and Figure 4, it follows that major changes of
Jones' tests. Such correlation suggests that the ice
parameters b and c, and ice strength take place at
cohesion magnitudes may not be sensitive to varia-
temperature below 10C. Between 10 and
tions of the grain size.
12C the ice strength changes insignificantly.
To make sure that this conclusion extends
beyond the temperature range between 1 and
It is curious to compare, at least approximately,
16C, and that it is valid in the strain rate range
parameter b(T) and the kinetic friction coefficient
c of ice, although the physical nature of these
different from ~ 5 103 s1 used above in the
two parameters is quite different. Thus, Jones et
evaluation of the cohesion, a comparative analy-
9


 Previous Page
