23 should be combined with eq 2a through 4.
TEST DATA
Then eq 1 can be written as
The validity of the temperature dependencies
τ *(p, ε, T) = τio (p, T)Φ(ε)
˙
˙
i
of the strength parameters of ice presented above
was verified using test data of Gagnon and
1/n
ε
(24)
˙
b(T)
Gammon (1995). The triaxial (σ2 = σ3) compres-
= c(T) + b(T) p -
p2
2σmax (T) εo
˙
sion tests were carried out using cylindrical speci-
mens of Labrador iceberg ice, 9.58 cm in diameter
In the range of the hydrostatic pressures p <<
and 26 cm long. Mean grain diameter d ≈ 8.1 mm.
σmax, eq 24 takes the form
The test temperature varied between 1C and
16C. The tests were conducted at constant axial
1/n
ε
˙
strain rates between 102 and 105 s1. Test data
τ* (p, ε, T) = [c (T) + b (T)p]
˙
(25)
i
corresponding to the strain rate εo ≈ 5 10-3 s-1
εo
˙
˙
were selected in the following analysis to evalu-
when p = 0 (pure shear)
ate the strength parameters of ice. This strain rate
was defined by the authors of this report as the
1/n
ε
˙
instantaneous strain rate because the test strength
τ* (ε, T) = c (ε, T ) = c (T )
˙
˙
(26)
i
εo
˙
magnitudes at this rate reached their maximum
values. The tests were carried out at four different
Accordingly
confining pressures: 1.38, 3.45, 6.89 and 13.79 MPa.
1/n
The test data replotted by the authors of this re-
ε
˙
port in terms of the shear strength τ i = (σ1 - σ 3 )/ 3
b (ε, T) = b(T )
˙
(25a)
εo
˙
vs. the hydrostatic pressure p = (σ1 + σ 2 + σ 3 )/3
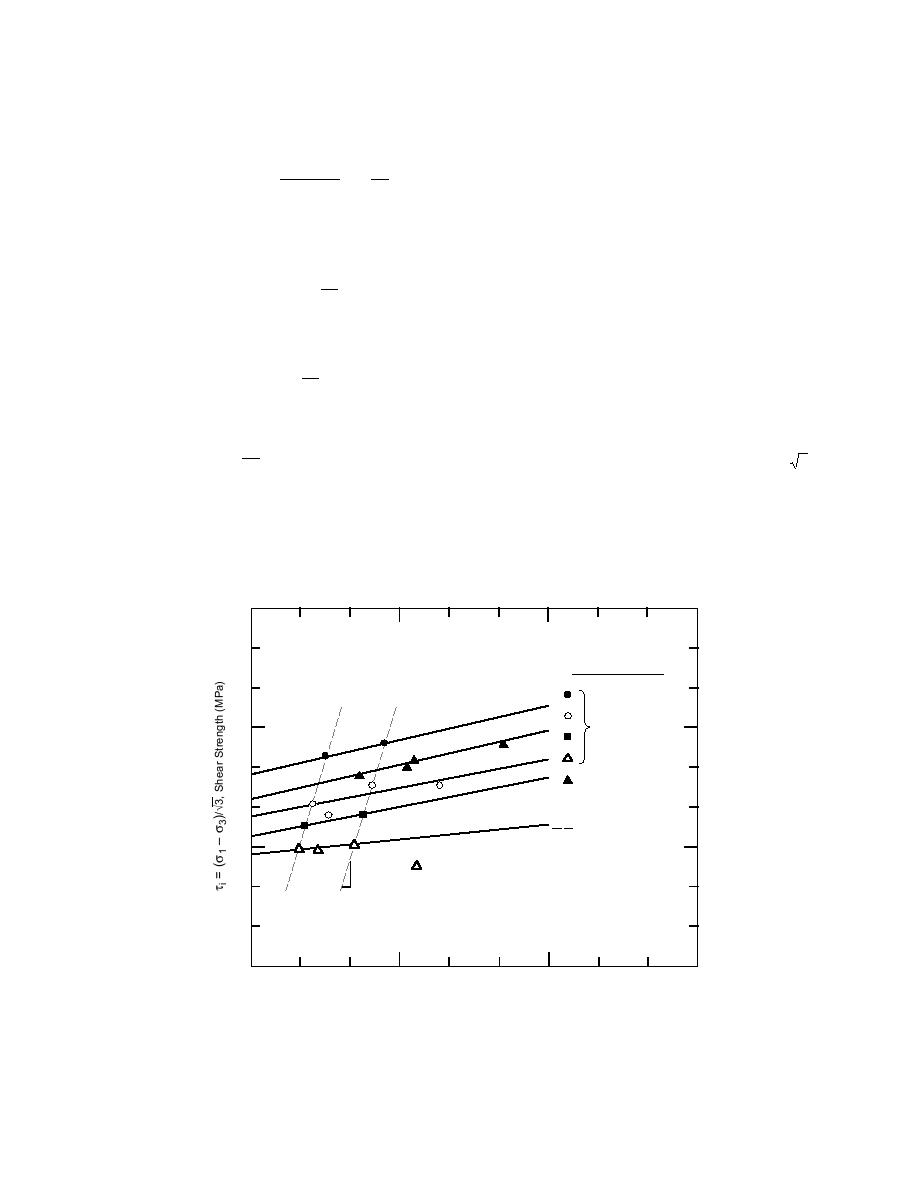
are presented in Figure 3. Note that each point in
where parameters c(T) and b(T) are correspond-
ing to the strain rate ε = εo .
Figure 3 represents the mean of five tests.
˙˙
In Figure 3 for comparison tests, data are pre-
If the radial strain rates are taken into account
function Φ(ε) in eq 24, 25 and 26 should be re-
sented on triaxial compression of freshwater poly-
˙
placed by function Φ( γ).
crystalline ice obtained by Jones (1982). The ran-
˙
18
σ1 = 3
σ2 = σ3
.
ε1 ≈ 5100 s1 1
13 3 s
=5
σ3 = 1.38 MPa
σ3 = 6.89 MPa
16C
Labrador Ice
11.8
12
(data from
Gagnon and
Gammon, 1995)
11
6
Polycrystalline Ice
(data from Jones,
1982)
1
σ3 Trajectory
6
√3
0
15
30
45
p , Hydrostatic Pressure (MPa)
Figure 3. Strength test data of ice under triaxial compression. Data from Gagnon
and Gammon (1995) and Jones (1982).
7


 Previous Page
