160
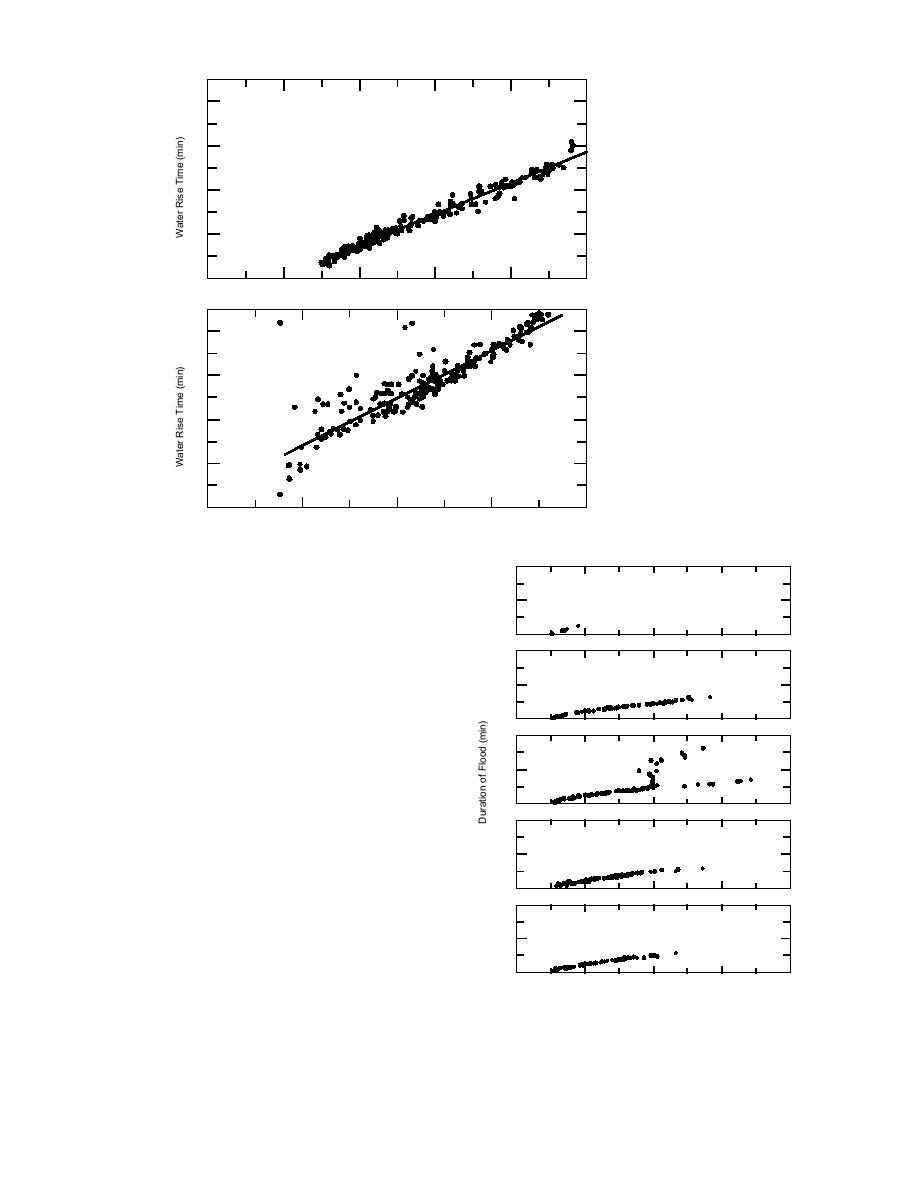
Parachute Gully
120
80
40
R2 = 0.912567
0
3.0
3.5
4.0
4.5
5.0
5.5
160
Racine Gully
(7 points off graph)
120
80
40
R2 = 0.255974
0
1
2
3
4
5
Figure 40 (cont'd).
Peak Water Elevation (m)
flats are inundated at 4.9 m and levees are cov-
480
Racine Gully
ered at 5.2 m (Fig. 39). Only at Racine Island was
240
there a difference; here, survey data indicate a
4.35-m threshold for pond flooding at the south
0
end. The former elevations also yielded a linear
480
relationship between the period of flooding (i.e.,
Parachute Gully
time when water elevation was greater than 4.6
240
m) and peak water elevation (Fig. 41). Estimates
of how often each landform is flooded in a given
0
time period can be based upon these elevations.
480
The timing of flooding is controlled by the el-
B Gully
evation of the levees and mudflats surrounding
240
the gullies, the distance of the gully headwall
from the coast, and the gully length. Water mov-
0
ing down the river can also alter the timing of
480
In-Between Gully
flooding inland from the coast, depending upon
its volume relative to the volume of tidal waters.
240
Analyses show that tidal flooding is best described
0
by a polynomial regression (Lawson et al. 1996).
480
Pond drainage is restricted by gully parame-
Bread Truck Gully
ters (cross-sectional area, channel roughness and
240
drainage density) that limit the volume of water
that can escape from the pond. This produces
0
a bottleneck effect where water in the pond re-
4.4
4.8
5.2
5.6
6.0
Peak Water Elevation (m)
mains dammed despite turbulent, fast flowing
conditions in the gully heads. The response is a
Figure 41. Tidal flooding time as a function of peak
nonlinear relationship between water elevation
flood elevation at selected gullies.
51


 Previous Page
