Table 11. Comparison of predicted and measured number of flooding events
reaching critical heights during summer 1994 and summer 1995.
Number of flooding events
Summer 1994
Summer 1995
Summer 1996
Critical height
Predicted
Measured
Predicted
Measured
Predicted
Inundate ponds (4.6 m)
16
52
33
38
44
Cover mudflats (4.87 m)
8
18
10
22
25
Cover levees (5.21 m)
0
4
0
1
2
Summer 1994 is 22 May15 September; summer 1995 is 5 May11 September; predicted means
based on Thompson tide table at Anchorage; measured means based on depth transducer at
Bread Truck gully; time periods are intervals between sedimentation measurements.
40
Summer `92
Winter `92-'93
Summer `93
Winter `93-'94
Summer `94
30
Winter `94-'95
Summer `95
20
10
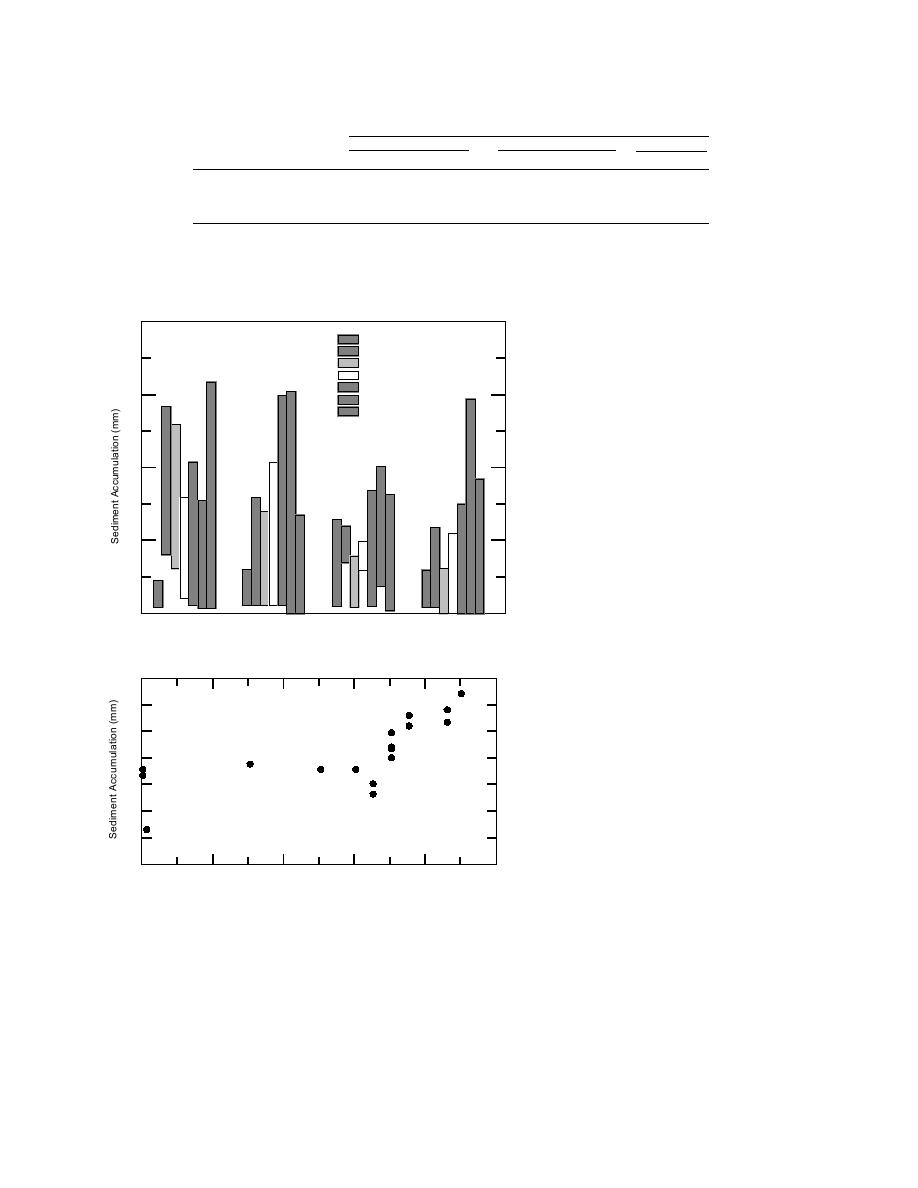
Figure 47. Variations in sedimentation rate
0
Pond
Vegetated
Unvegetated
Levee
as a function of landform type.
Mudflat
Mudflat
35
30
25
20
15
10
Figure 48. Relationship between total sedi-
5
ment accumulation and vegetation cover at
sites sprayed with paint in 1992 and mea-
0
20
40
60
80
100
sured in the fall of 1994.
Vegetative Cover (%)
with less than 6065% vegetative cover, and 26
Knik Arm into coastal Area A (Fig. 9). The de-
32 mm at sites with a vegetation cover of greater
creased velocities of Knik Arm waters during
than 70%.
flooding reduce their ability to transport sedi-
Sedimentation rates also vary with distance
ment, causing rapid sedimentation near the coast.
from source waters. A decrease in sedimentation
The same effect is often seen along the scarp of
many gullies where flow conditions change rap-
rate with distance inland is illustrated by transect
idly as flood waters overtop their banks. Sedi-
16 data (Fig. 49a), which extends southward from
55


 Previous Page
