720
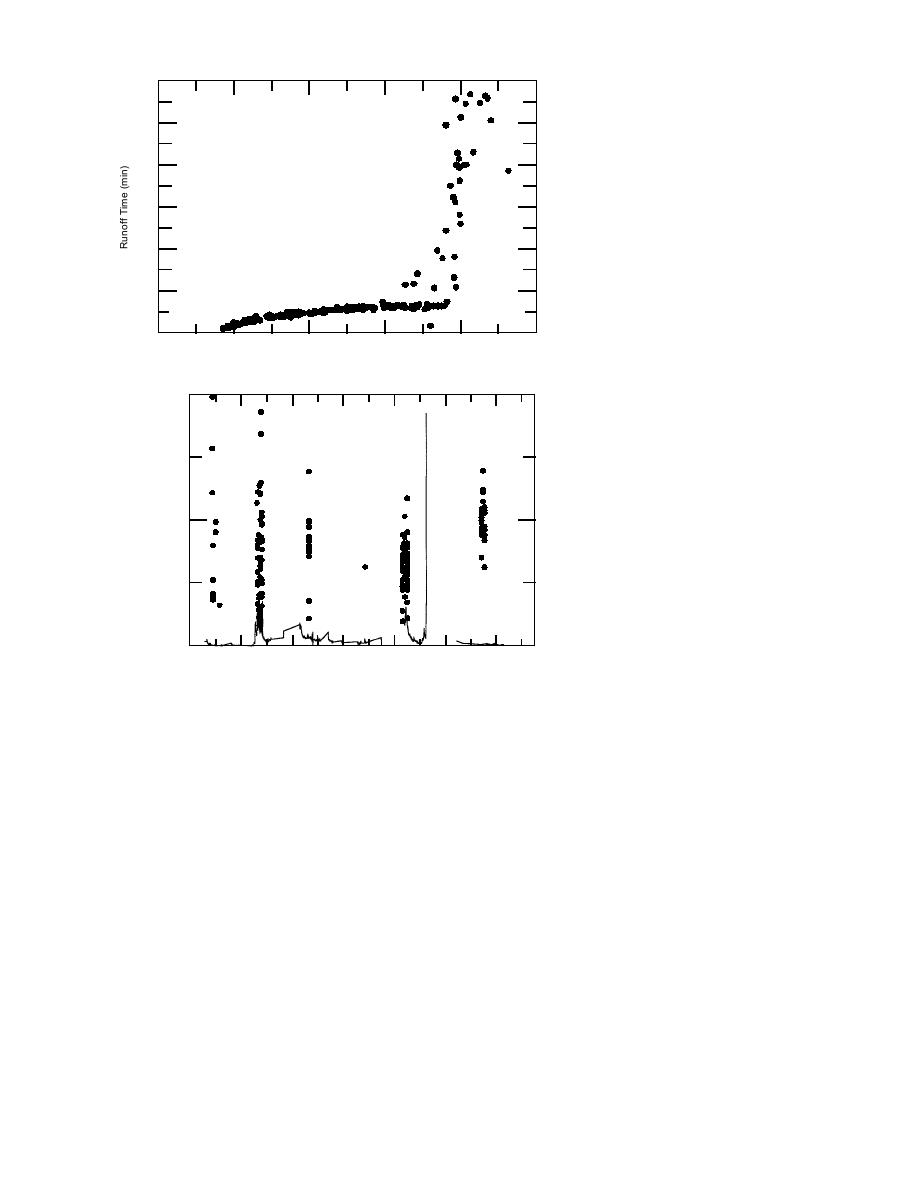
Bread Truck Gully
600
480
360
240
Figure 42. Runoff time vs. peak water
120
elevation at Bread Truck Gully. The
change in slope reflects the effect of
0
pond drainage where runoff is extended
3.0
3.5
4.0
4.5
5.0
5.5
once ponds are flooded.
Peak Water Elevation (m)
4000
Coast
TSS
(mg/L) 2000
Figure 43. Coastal vs. river TSS mea-
surements. The large spike in mid-Sep-
River
tember indicates a flooding event in
0
the Eagle River watershed.
4 May `95
3 Jun
3 Jul
2 Aug
1 Sep
1 Oct
31 Oct
and runoff time (Fig. 42), which, in effect, extends
maximum glacial runoff (Fig. 43; Lawson et al.
the time for sedimentation. Drainage is incom-
1996). The higher sediment concentrations in Knik
plete between consecutive tides exceeding 5.0 m,
Arm reflect the high sediment influx from the
furthering the time available for sedimentation.
large glacierized basins of the Susitna, Matanuska
and Knik rivers (Fig. 1). The increase in TSS val-
Sediment transport
ues in Knik Arm during fall and winter probably
and sediment sources
reflect the effects of colder water and increased
Sediment transported in suspension from Knik
salinity (both of which affect its viscosity). In the
Arm is the primary source for ponds, and it var-
Flats, reduced discharge in fall and winter from
ies seasonally as well as during single tidal cycles
the Eagle River minimizes dilution by fresh water
(from flood to ebb) (Lawson et al. 1996). TSS mea-
with a much lower sediment concentration, al-
surements in Knik Arm exceed those at the river
lowing more saline water with a greater sediment
(which are quite low) throughout the year and
concentration to enter the ponds and mudflats.
show a general increase in sediment concentra-
Sediment flux into and out of the ponds and
tion through the summer season (Fig. 43). In con-
mudflats varies monthly as tidal height, flood
trast, TSS concentrations vary seasonally in the
duration and runoff time vary (Fig. 44). TSS con-
Eagle River, being relatively high through June
centrations vary among the gullies through a
and September, with peaks in mid-June and early
single tidal cycle and reflect distance inland from
August during snowmelt in the mountains and
the coast, as well as spatial variations in runoff,
52


 Previous Page
