Table 10. Gross sedimentation rates.
Range (mm)
Sum.
Win.
Sum.
Win.
Sum.
Win.
Sum.
Morphological unit
1992
199293
1993
199394
1994
199495
1995
Levee
16
112
06
011
015
030
017
Vegetated mudflat
16
116
114
121
130
031
013
Unvegetated mudflat
113
712
18
610
117
321
017
Pond--plate
14
828
626
217
121
116
137
Pond--cup
29
826
619
113
220
940
139
Marsh
ND
ND
ND
ND
120
210
113
Gully
177
2033*
019
016
119
350
660
* Based on small sample size.
Measurements for seasons through winter 199394 are from transect lines 112 only, Summer
1994 and 1995 measurements from lines 124 (Fig. 9).
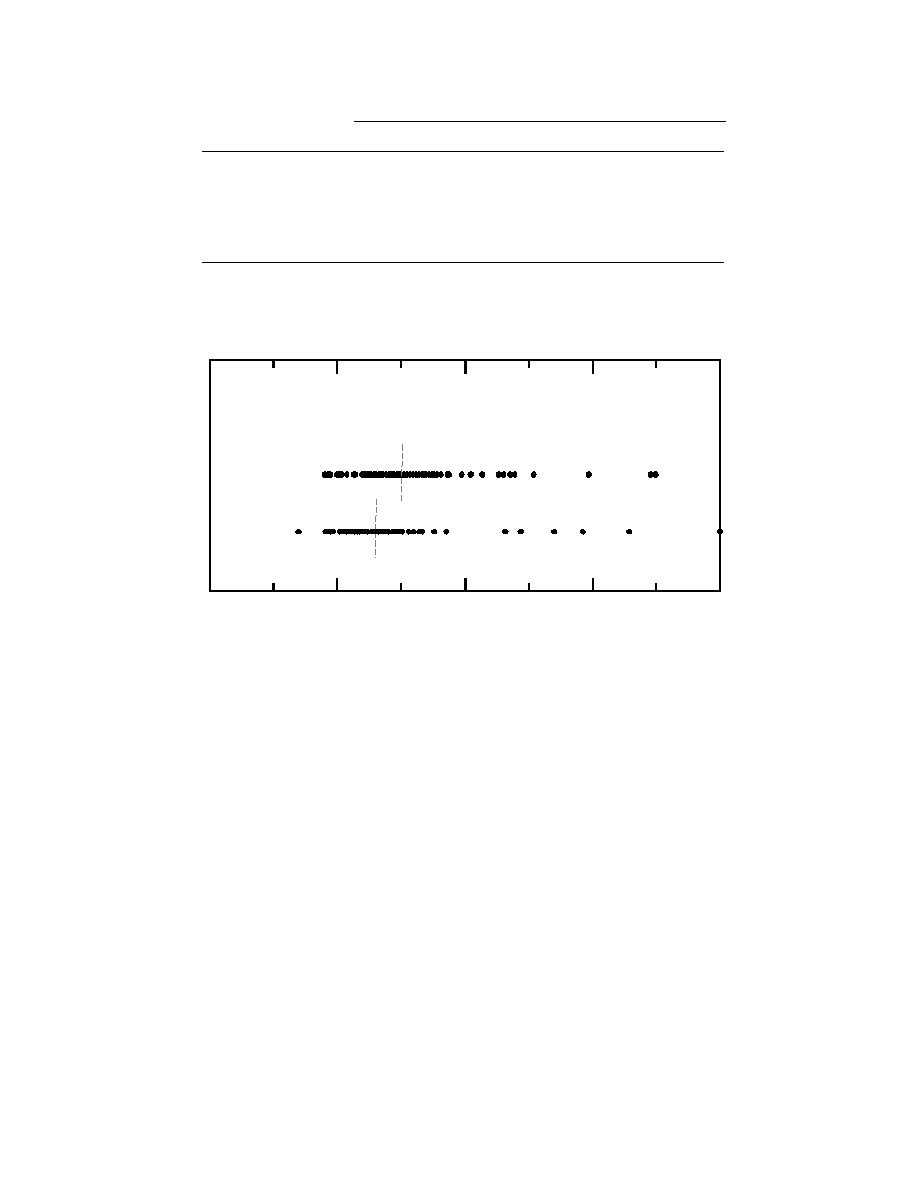
Avg. Sedimentation
for Time Period
Winter `94-'95
Individual Sedimentation Measurements
Summer `95
20
0
20
40
60
Sediment Accumulation (mm)
Figure 46. Net seasonal accumulation rates at sites spray-painted in the C and D areas.
river discharge, ice cover and wind. There was
reflects their respective length of measurement,
significantly more tidal flooding at each hydro-
the seasonal increases in TSS within the source
station site during both 1994 and 1995 than pre-
waters during the early winter months (Fig. 44),
dicted by using the Anchorage datum (Table 11).
the trapping of sediment by the snow cover, and
Given this scenario, floods should far exceed that
the number of flooding events. Net accumulation
number again in 1996.
measurements from the paint-layer technique vary
During summer, about twice as many floodings
seasonally for the periods of September 1994
occur than predicted, but fewer take place in win-
through May 1995 (winter) and May 1995 through
ter, presumably because of the seasonal reduc-
September 1995 (summer) in Area C and Area D
tion in river discharge (Table 11). Flooding of the
mudflats and levees (Fig. 46). Most winter values
various landforms is therefore also affected. The
fall in the range of 2 to 18 mm (average 10 mm),
number of inundations is highest for ponds, be-
while the summer values range between 2 and
ing less on mudflats and levees, thereby correlat-
+14 mm (average 6 mm).
ing with the general decrease in sedimentation
The relationship of sedimentation rate to el-
rates that characterizes this respective sequence
evation reflects the number of times the sites are
of landforms (Fig. 47).
inundated. The number of measured flooding
The amount of vegetation covering the mudflats
events exceeds that predicted from tidal eleva-
also influences the sediment accumulation rates
tions at Anchorage because of several factors,
(Fig. 48). Gross sedimentation rates from 1992 to
including tidal amplitude caused by the geom-
1994 had total accumulations of 618 mm at sites
etry of Knik Arm (e.g., Syvitski et al. 1987, p. 163),
54


 Previous Page
