50
S
N
40
Fall `94
Spring `95
Fall `95
30
20
10
0
100
200
300
400
500
a. Transect line 16.
Distance (m)
50
E
W
40
Fall `94
Spring `95
Fall `95
30
20
10
0
200
400
600
800
b. Transect line 14.
Distance (m)
50
N
S
40
Fall `94
Spring `95
Fall `95
30
20
10
0
100
200
300
400
500
c. Transect line 19.
Distance (m)
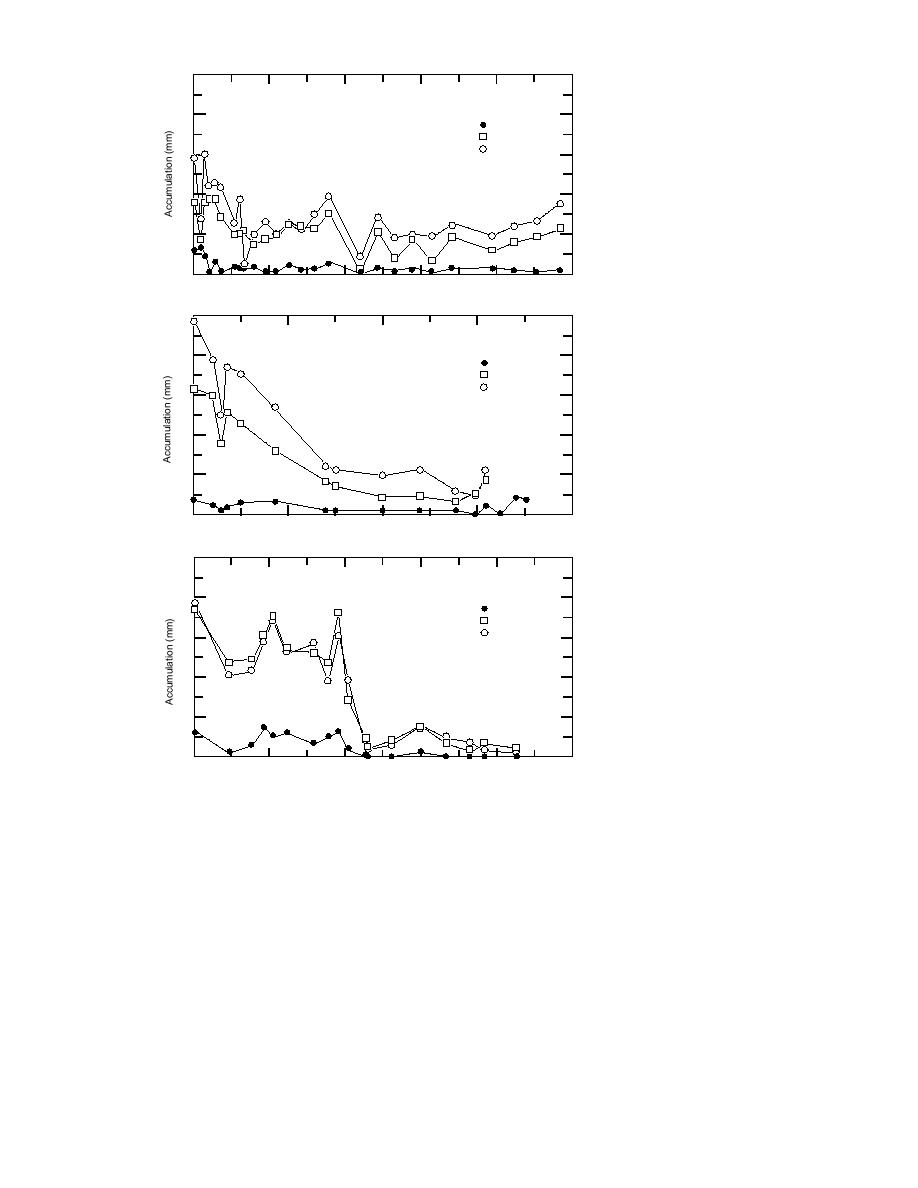
Figure 49. Sediment accumulation along mudflat lines sprayed with paint in early summer
1994 (see Fig. 9).
mentation rates decrease with distance from the
The plates and cups were measured in September
Eagle River inland toward the marshes adjacent
at each station on these transects, except in C/D,
to the uplands (Fig. 49b). We also observed high
where only cups could be measured. Sediment
accumulation rates at a low elevation oxbow area
that accumulated at the new pond sites during
on the north end of Racine Island that floods more
this first summer was liquefied and contained a
frequently than adjacent mudflats (Fig. 49c).
high organic fraction that we did not differentiate
from the mineralogical fraction. At sites where an
algal bloom was present in the water column
Pond transects and stations
Pond sedimentation transects were newly es-
above the measuring devices, we either gently
tablished in 1995 in Bread Truck, C/D, C,
removed or moved the material enough to see the
Lawson's, A and Racine Island ponds (Fig. 12).
sediment surface and obtain the measurement.
56


 Previous Page
