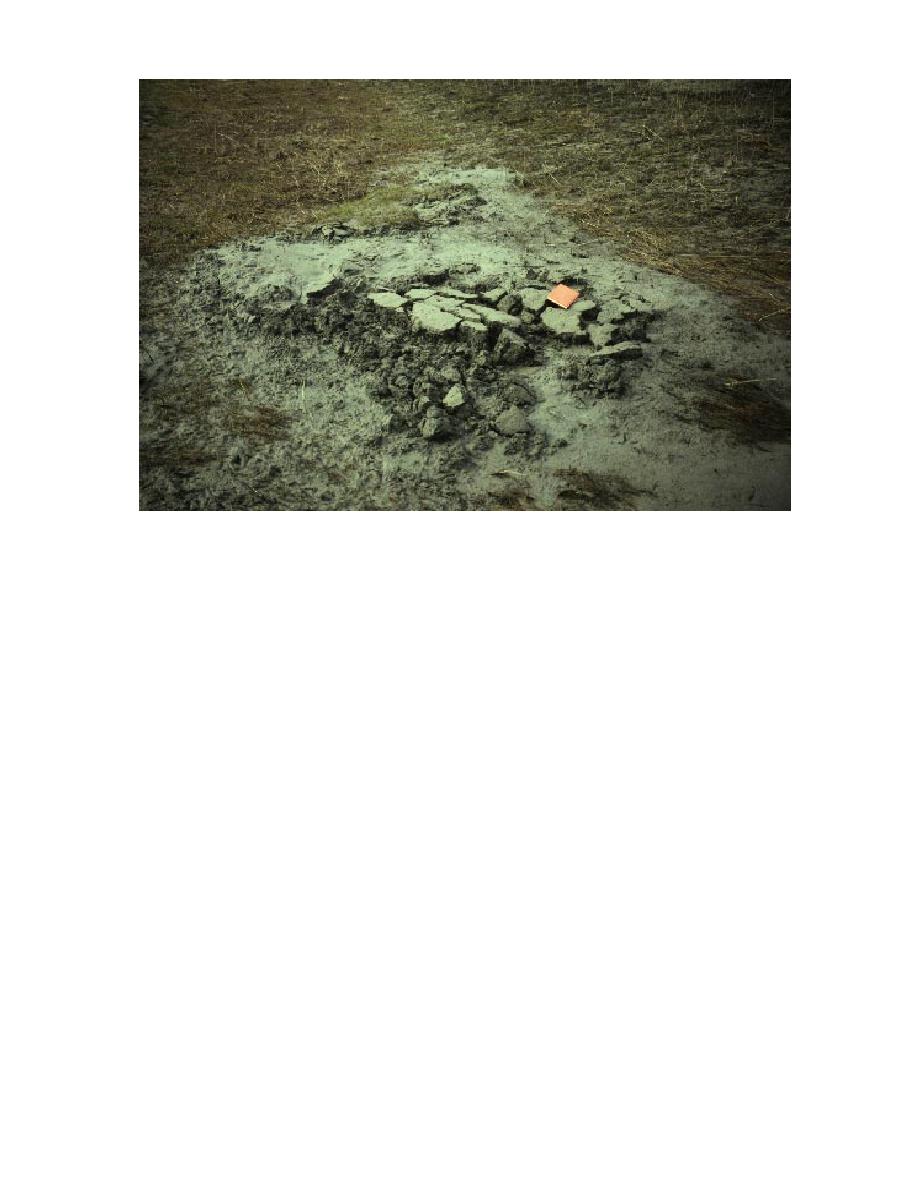
b. Ice-rafted sediment deposited at the head of Mortar Gully.
Figure 36 (cont'd). Ice rafting at ERF.
Flood waters first begin to drain near the coast
displacing the water over a large area, and caus-
at the start of ebb tide, and water levels inland
ing a decrease in the rate of water level rise (Fig.
progressively decrease. The duration of outflow
37). River waters are dammed, causing the river
during ebb is greater than inflow during flood.
to reverse its direction in the upper Flats (Fig.
Pond sedimentation results mainly from set-
38). This damming effect causes the elevation of
tling-out of sediment suspended in the water col-
the river to rise higher than the elevation of water
umn; sediments are deposited in ponds and mud-
in the gullies and reverses flow direction in the
flats during and immediately following slack high
drainage systems. The effect may be accentuated
tide (Fig. 37b). Its duration and the height and
during peak discharge of the river. Water depths
volume of the flood water therefore determine
measured at the hydrostations and the tide gauge
sedimentation rates.
in Knik Arm show that the peak elevation on the
The length of time available for sedimentation
Flats exceeded the predicted tidal height for An-
during tidal inundation is directly related to peak
chorage by up to 0.7 m throughout the 1995 sum-
elevation and each landform's threshold for flood-
mer season (Fig. 39). The effect is to increase the
ing. The time between the start of water rise and
volume of water and hence sediment available
peak high tide was measured for each gully
for sedimentation.
hydrostation and compared to the peak water
At peak flood or slack high tide, water is
ponded upon the Flats. The mixing of flood wa-
elevation at each site. We found a linear relation-
ters with the existing pond and marsh waters
ship between water rise time and peak elevation
increases the amount of suspended sediment. In
(Fig. 40). Average elevations for tidal flooding
those ponds such as Racine Island Pond, which
across the Flats were estimated from surveyed
transects (Fig. 9). These data indicate that most
have the highest proportion of fresh river water
inundation, suspended sediment concentrations
drainageways feeding ponds begin to flood at a
tidal height of about 4.6 m above sea level, mud-
are less than where tidal sources dominate.
48


 Previous Page
