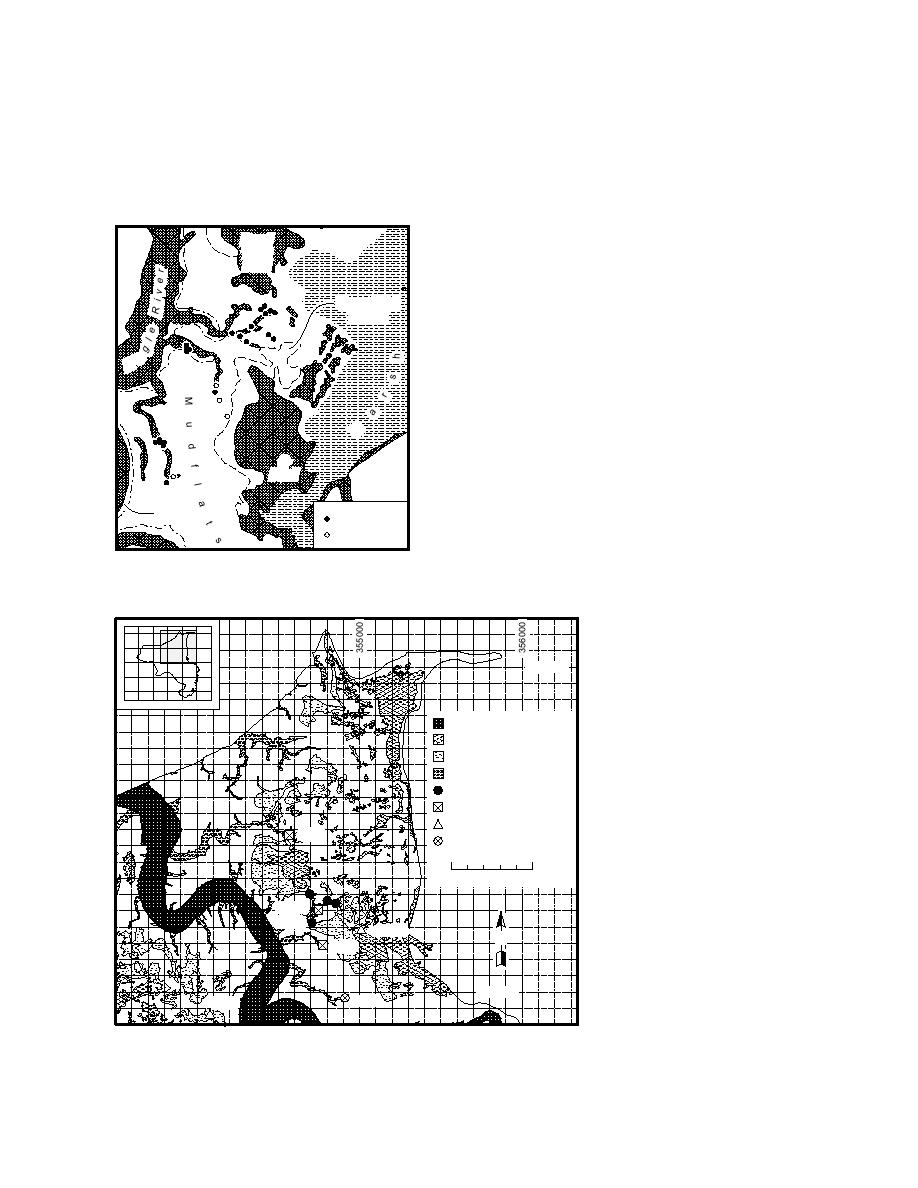
material in transport. Sediment in each sedimen-
sampled to determine if in fact ice was transport-
tation trap at the pond sites was sampled to see if
ing WP-contaminated pond sediments (Fig. 63).
Sediment and WP may be moved when the ice
WP particles were being resuspended and rede-
and frozen sediments are lifted off of the mudflat
posited in ponds.
during flooding tides and drift with the wind and
In addition, during November 1994, recently
tidal currents (Fig. 64a). During tidal ebb, the ice
transported and deposited ice floes having sedi-
can strand on the mudflat surface, and it often
ments frozen to their bottom surfaces were
piles up at the heads of gullies (Fig. 64b).
The plankton net, gully bottom, pond and ice
Bread
T
floe samples each carried WP-contaminated sedi-
Pruck
ments (Fig. 62b and 63). WP concentration ranged
ond
from 0.0013 to 0.0493 mg/kg in three out of four
plankton net samples taken during ebb discharge
UnM getated
ve
through B-Gully, following the four highest flood
udflat
cycles in September. Four out of eight samples
obtained from sediments frozen to ice floes yielded
a
E
WP concentrations that ranged from 0.001 to 0.013
mg/kg. Two resuspended sediment samples from
ponds in Area A and C ranged from <0.0014 to
0.003 mg/kg. These latter samples show that WP
M
can be resuspended, but this may be limited since
no samples from other sites have yet tested posi-
PC
ond
tive for WP.
Both the suspended load and bedload trans-
port samplings and those from ice floes are sig-
Levee
D
Not Detected
nificant. The ice floe samples that we obtained
etected
while walking along a transect from the EOD pad
a. Positive results of previous sampling of gully
to the Bread Truck Gully site are the first from
bottom sediments.
ERF. Samples were collected if the ice floes en-
6803000
P
Eagle River
I ermanent Pond
D termittent Pond
n
I rainage Gully
Ice Sample (no detection)
S e Sample (detection)
c
Pediment Station (detection)
0.001
lankton Net
0
500 m
0.0045
0.0043
<0.0014
N
0.013
b. Positive results of 1994 sampling
6801000
of sediment and water samples by
0.001
0.003
gully currents and ice floes.
Figure 62. Location maps for WP.
50


 Previous Page
