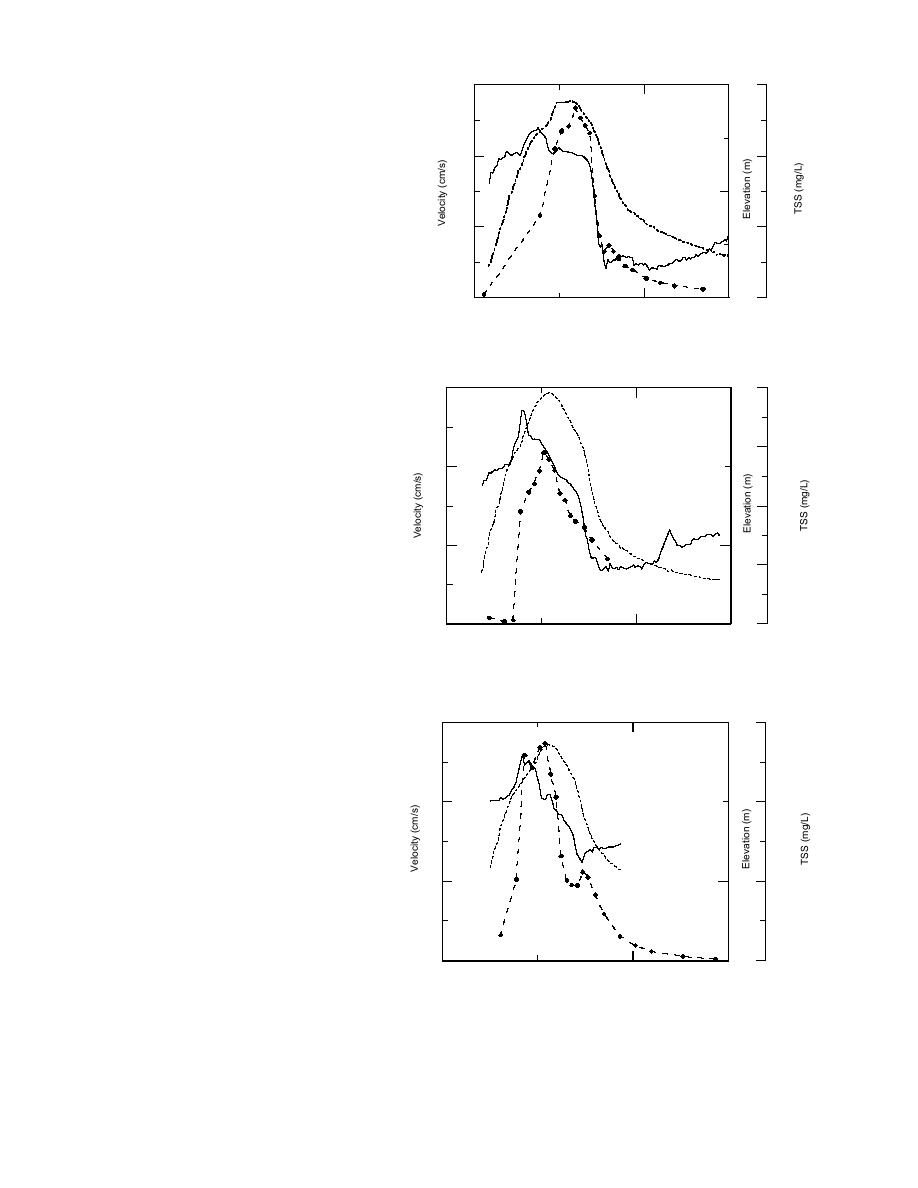
Gully discharge
3000
6
100
The volume of water that flows through
a gully is mainly a function of the height
of tidal inundation, including its supple-
ment by the river and any additive effects
0
2000
of wind, ice and any other factor that may
reduce gully cross-sectional area. The ve-
4
Elevation
locity range and magnitude of the flood
and ebb currents determine the flux of
1000
100
sediment and water from the ponds and
Velocity
mudflats, as well as gully erosion.
The velocity of tidal flood and ebb cur-
TSS
2
0
200
rents at the Bread Truck, Spring and Para-
18:00
00:00 (hr)
chute gullies differs greatly in magnitude
6 Oct 1994
7 Oct 1994
among these sites, but the peak ebb veloc-
a. Spring Gully.
ity in each instance is greater than the
peak flood velocity (Table 16). Velocity
asymmetry is greatest between the ebb
2000
100
6
and flood in Spring Gully and the small-
est in Parachute Gully (Fig. 58). The mag-
nitude also changes with the height of
1500
flooding (Fig. 59), the lower peak and
0
range in velocities occurring during the
lower elevation flooding tides. Velocities
1000
are greatest in Spring Gully, with moder-
Velocity
ate values recorded in Bread Truck Gully
100
4
and the lowest values in Parachute Gully
500
(Table 16).
The flood and ebb asymmetry deter-
Elevation
mines the net transport of sediment. Dur-
TSS
ing flood, gully water levels generally rise
200
0
18:00
00:00 (hr)
passively before spreading onto the
6 Oct 1994
7 Oct 1994
mudflats (Fig. 60). Then, the amount of
b. Bread Truck Gully.
sediment in suspension is probably lim-
ited to the amount in the water source,
mainly Knik Arm. In contrast, higher
100
6
3000
velocities during ebb mean increased tur-
bulence and potential for entraining sedi-
ment and thereby resulting in a net flux
out of ERF. More energy is also available
0
to cause bank and bed scour across the
2000
mudflats and within the gullies.
Discharge has been calculated for the
Velocity
Bread Truck, Parachute and Spring gul-
Elevation
lies, where current meters were located 1
100
4
1000
m above the bed. The cross-sectional ar-
eas in each gully (Fig. 61) were used with
the peak and mean velocities to estimate
TSS
the discharge (Q) (Table 16, App. D) by
200
0
18:00
00:00 (hr)
Q = VA
6 Oct 1994
7 Oct 1994
c. Parachute Gully.
where V is velocity and A is the cross-
Figure 58. Velocity during flood and ebb in a single tidal cycle.
sectional area.
47


 Previous Page
