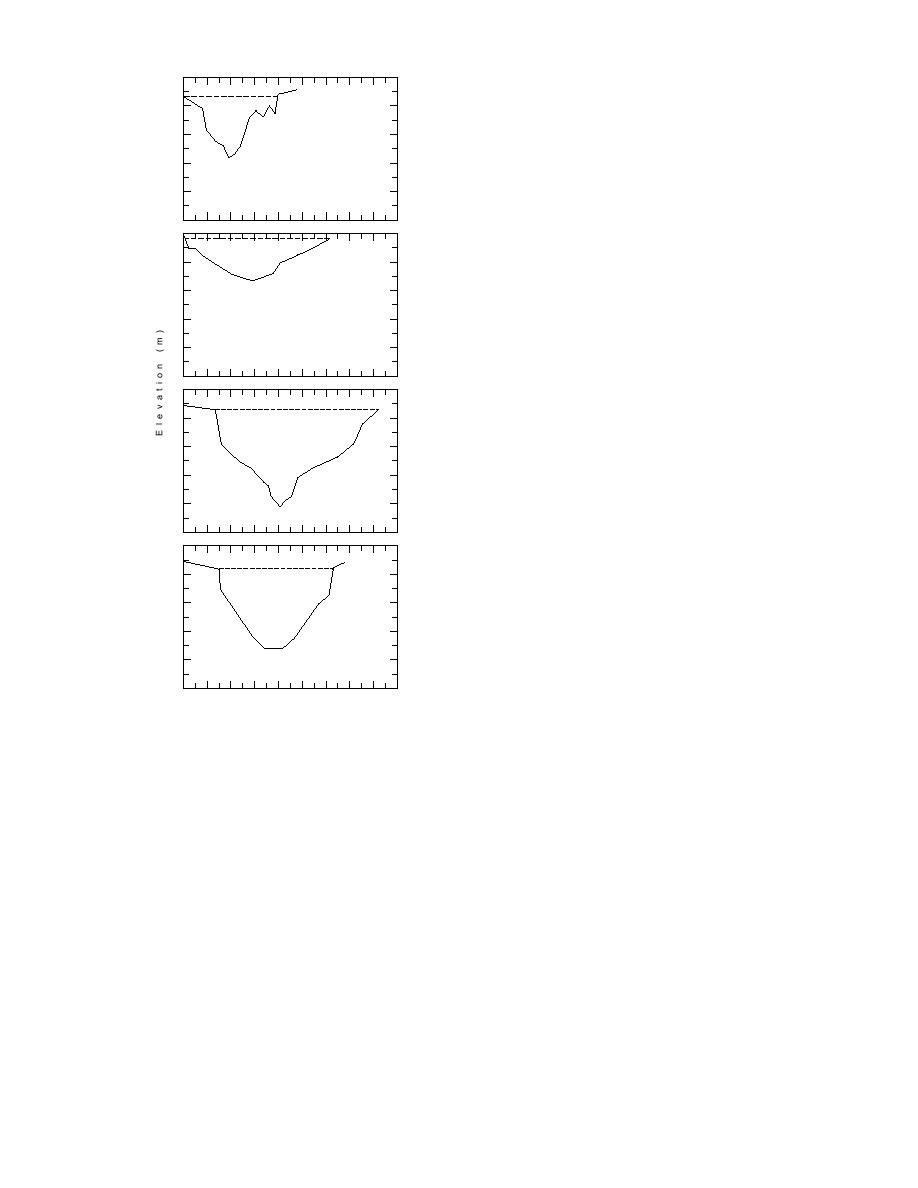
5
Average velocities of 25.0 and 76.1 cm/s were
used for Bread Truck Gully calculations, 27.1 and
4
47.0 cm/s for Parachute Gully, and 15.5 and 101.9
3
cm/s for Spring Gully.
Average discharge values in Bread Truck Gully
2
were about three times greater during ebb than
flood (~4.1 vs. 4.3 m3/s), with a peak ebb dis-
1
a
Bread Truck Gully
charge of 8.0 m3/s. The difference in flood and
0
ebb discharge at Parachute was slightly less over-
5
all (~1.2 vs. 2.6 m3/s), peaking at 4.0 m3/s. At
Spring Gully, the difference is over 4 to 1 (~1.2 vs.
4
5.8 m3/s); peak ebb is 9.7 m3/s.
3
Peak and average TSS concentrations collected
over the same time intervals were then combined
2
with discharge calculations to make rough esti-
1
mates of flood and ebb sediment fluxes (App. D).
b
Parachute Gully
Ebb sediment flux exceeded flood sediment flux
0
in each case, ranging from 2 to 3 times more dur-
5
ing ebb. Peak sediment flux during ebb ranged
4
from 33.7 kg/s at Spring Gully, to 11.2 kg/s at
Parachute Gully, to 10.9 kg/s at Bread Truck
3
Gully.
2
The calculated ebb and flood sediment flux
data suggest that there should be a net transfer of
1
c
Spring Gully
sediment from ERF into Knik Arm, if these calcu-
lations are representative of the summer and this
0
5
relationship holds during the winter when we
don't have any data. Our sedimentation data in-
4
dicate a higher overall rate during times of ice
3
and snow cover. Without data on runoff, includ-
ing sediment discharge, it is difficult to examine
2
this problem further.
1
d
Spring Gully
WHITE PHOSPHORUS
0
2
4
6
8
10
12
14
16
18
EROSION AND TRANSPORT
Distance (m)
Figure 61. Gully cross sections at the
White phosphorus may be eroded and trans-
location of flow probes in Bread Truck
ported with sediment by wind, river and tidal
and Parachute. Two cross sections from
currents in summer. During winter, ice forming
Spring Gully represent the gully profile
on the ponds and mudflats as frazil and anchor
at the hydrolab (c) and the flow probe (d).
ice within both freshwater and saltwater bodies
has the potential to entrain and transport sedi-
Data for October and November 1994 were
ments with WP (Fig. 62). It is critical to determine
divided into their flood and ebb components us-
if transport of WP by these processes is quantita-
ing the tidal inundation data in Appendix C. Cal-
tively important in moving it to other locations in
culations were based on average flood velocities
ERF proper or elsewhere in the Eagle River and
ranging from 13.4 to 32 cm/s and ebb velocities
Knik Arm. Ice and water may deposit WP-bear-
ranging from 45 to 124.6 cm/s. Peak velocity
ing sediments where waterfowl, fish, invertebrates
ranged from 37.4 to 71.1 cm/s during flood and
or other potential receptors may ingest them.
72.0 to 176.2 cm/s during ebb.
WP-contaminated sediments transported as
Using the measured average and peak veloci-
suspended or bedload in gullies were sampled
ties, we estimated flood and ebb discharge for
using a plankton net (Fig. 19). Recent gully bot-
other months without measurements (App. D).
tom deposits were also sampled as surrogates for
49


 Previous Page
