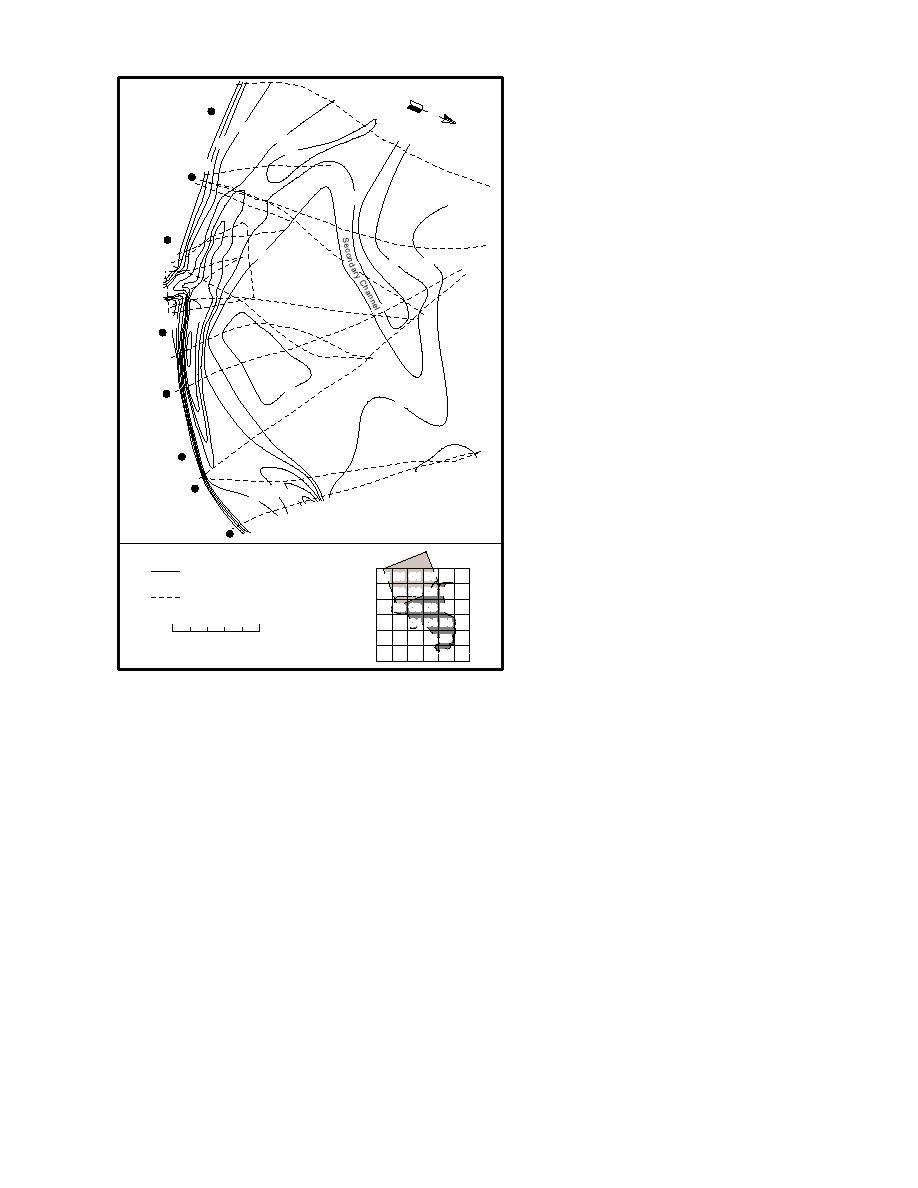
WP deposition. These areas include the
two intertidal bars mentioned previously
Coastal 7
N
(Fig. 66). In addition, there may be depo-
6
sition along the coastline of ERF in zones
8
4
10
where eddies develop during tidal inun-
0
dation and in the early stages of ebb. Sedi-
Coastal 6
ment appears to be accumulating along
8
the upper beach slope as well. These sedi-
ments probably come from suspension
Coastal 5
Bar
settling near slack high tide and during
6
4
the initial ebb.
6
Because our data indicate that WP-
EMgle R.
a
outh
contaminated sediment is being trans-
ported by ice and water into gullies that
14
0
drain into the Eagle River, we recommend
CNew
oastal
that further analyses of offshore areas in
Bar
Knik Arm be undertaken. These studies
should include sampling of suspected ar-
4
4
eas of deposition for analysis of WP.
Coastal 4
Coastal 3
GROUND WATER
INFORMATION
Coastal 2
10
12
8
Data on ground water conditions in
ERF are severely limited, but suggest that
Coastal 1
conditions may vary widely. We currently
have four sources of data available (Fig.
(
Bathymetric Contour Line
A1 B1 C1 D1 E1 F1
L I = 2m)
C
68): piezometer measurements from three
A2 B2 C2 D2 E2 F2
Tocation of Echo-Sounding
areas in 1994 and Druck pressure trans-
A3 B3 C3 D3 E3 F3
ransect Lines
ducer measurements from a single shal-
A4 B4 C4 D4 E4 F4
A5 B5 C5 D5 E5 F5
low well in 1993. We established 4 pi-
0
500 m
A6 B6 C6 D6 E6 F6
ezometers in Bread Truck, 9 on a transect
from C-Pond to the Eagle River and 15
Figure 66. Bathymetric map of the Knik Arm near the mouth of
piezometers in four groups in the C-Pond
the River and adjacent to the coast of ERF. Datum is mean
area for this study (Fig. 68). The other
Anchorage sea level.
piezometer groups consisted of three to
five piezometers per set, located at differ-
The second bar extends north beyond the area
ent depths below the ground surface, depending
that we have monitored. Both intertidal bars rep-
on site conditions. Each cluster provides data on
resent large zones of temporary sediment storage
vertical gradients. Between the initial installation
within Knik Arm.
and first measurement, three clusters went dry as
A third, smaller intertidal bar forms a sharp
the surface elevation of C-Pond lowered. These
peninsula that protrudes northwest into the Knik
groups were then reestablished within the inter-
Arm from the northeast bank of the Eagle River
mittently flooded area of the pond; they were
mouth. Transect Line L (Fig. 67) turns at this bar
measured twice after flooding in early September
across the Eagle River mouth, showing it to have
(Fig. 68). A single cluster in the permanently
a relatively flat bed and a depth of only 23 m
ponded area of C-Pond (Fig. 68) was measured
below Anchorage mean sea level.
three times during the summer.
Piezometers in C-Pond recorded elevated wa-
ter levels in September whenever the sites were
Potential areas of
flooded (Fig. 69). Piezometers that were set deep-
WP deposition
The bathymetric data show that several areas
est within the muddy substrate of the ponds gen-
in Knik Arm are potential sites of sediment and
erally recorded the highest level of elevation above
54


 Previous Page
