Channels above each headwall are lined by
GULLY HYDRAULICS
vegetation and the bed slope ranges from 0.1 to
AND DISCHARGE
0.6 m/km, generally being less than gradients in
the gully proper. With distance, slopes gradually
Gully profiles
Longitudinal profiles of nine gullies, surveyed
reverse in direction and dip towards the ponds
along their central channel or thalweg, have sev-
across the unvegetated mudflats. The divide rep-
eral characteristics in common. Each gully in the
resents a critical threshold beyond which gully
area east of Eagle River has moderate to rela-
extension will capture the pond and accelerate its
tively steep slopes downstream of an eroding
drainage. As erosion continues, the lower thresh-
headwall (e.g., Fig. 49). The headwall region has
old for pond drainage may extend the duration of
a nearly vertical face ranging from 1.2 m to over
and possibly the volume of water flow through
2.0 m in height. At the base of the headwall is a
the gully, further accelerating erosion and
depression or plunge pool scoured by water flow-
headwall recession.
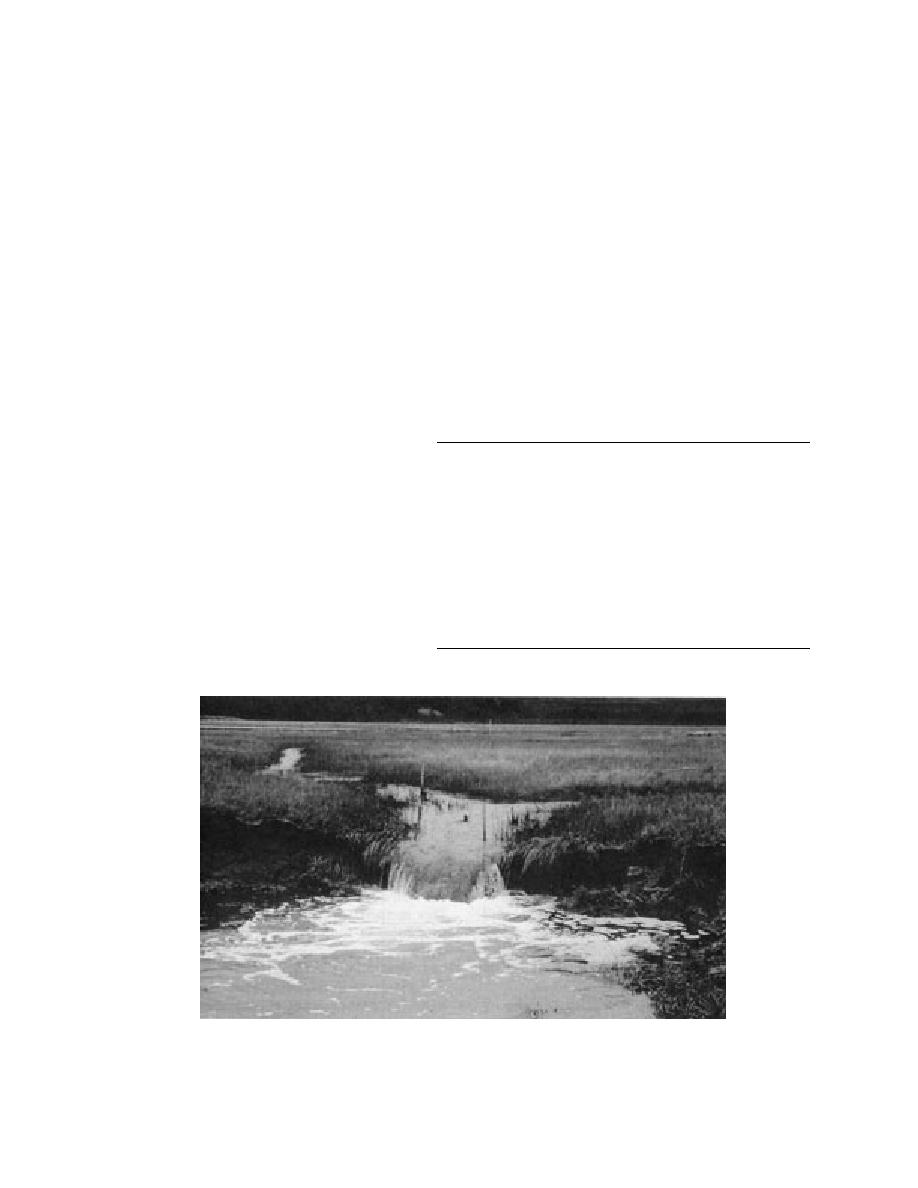
ing over it (Fig. 57). These plunge pools range in
depth from about 0.5 to over 2.0 m.
Channel gradients are steepest near the
Eagle River (1.0 to 2.0 m/km). The steep bed
slope here probably results from the large Table 16. Discharge calculations for October and Novem-
range in tidally controlled variations in water ber 1994.
level and discharge in the river proper. Up-
Spring Gully Bread Truck
Parachute
gradient of this steep section, the gradient
shallows (0.3 to 0.7 m/km), producing a con- Cross-sectional area (m2)
26.5
5.5
9.8
Peak flow (cm/s)
cave upward profile that then progressively
Flood
51.82
84.17
64.97
steepens with distance to the base of the
Ebb
177.06
146.41
75.71
headwall (Fig. 49). At one or more locations Mean flow (cm/s)
in the gully, short segments of the channel
Flood
15.07
21.92
10.48
Ebb
66.06
69.42
50.31
exhibit the sharp increases in gradient
3/s)
(knickpoints) that signify that the bed profile Peak discharge (m
Flood
13.73
4.63
6.65
is not in equilibrium with the existing hydro-
Ebb
46.92
8.05
7.42
logical conditions. Further, they indicate ac- Mean discharge (m3/s)
tive scour of the bed as the gully thalweg
Flood
3.99
1.21
1.03
Ebb
17.51
3.82
4.93
deepens and the channel gradient lessens.
Figure 57. Water flowing over gully headwall at Parachute Gully plunge pool.
46


 Previous Page
