0
LINE A
4
8
Main Channel
Bed
12
16
South
North
20
0
LINE D
Secondary
Main
4
Channel
Channel
8
Bed
12
16
North
South
20
0
LINE F
4
Main Channel
Secondary Channel
8
Bed
12
16
North
South
20
0
LINE H
4
Secondary
Main
8
Channel
Channel
Bed
12
16
North
South
20
0
River
LINE L
4
Mouth
Main
Channel
8
Bed
Turn
Turn
12
16
West
West
20
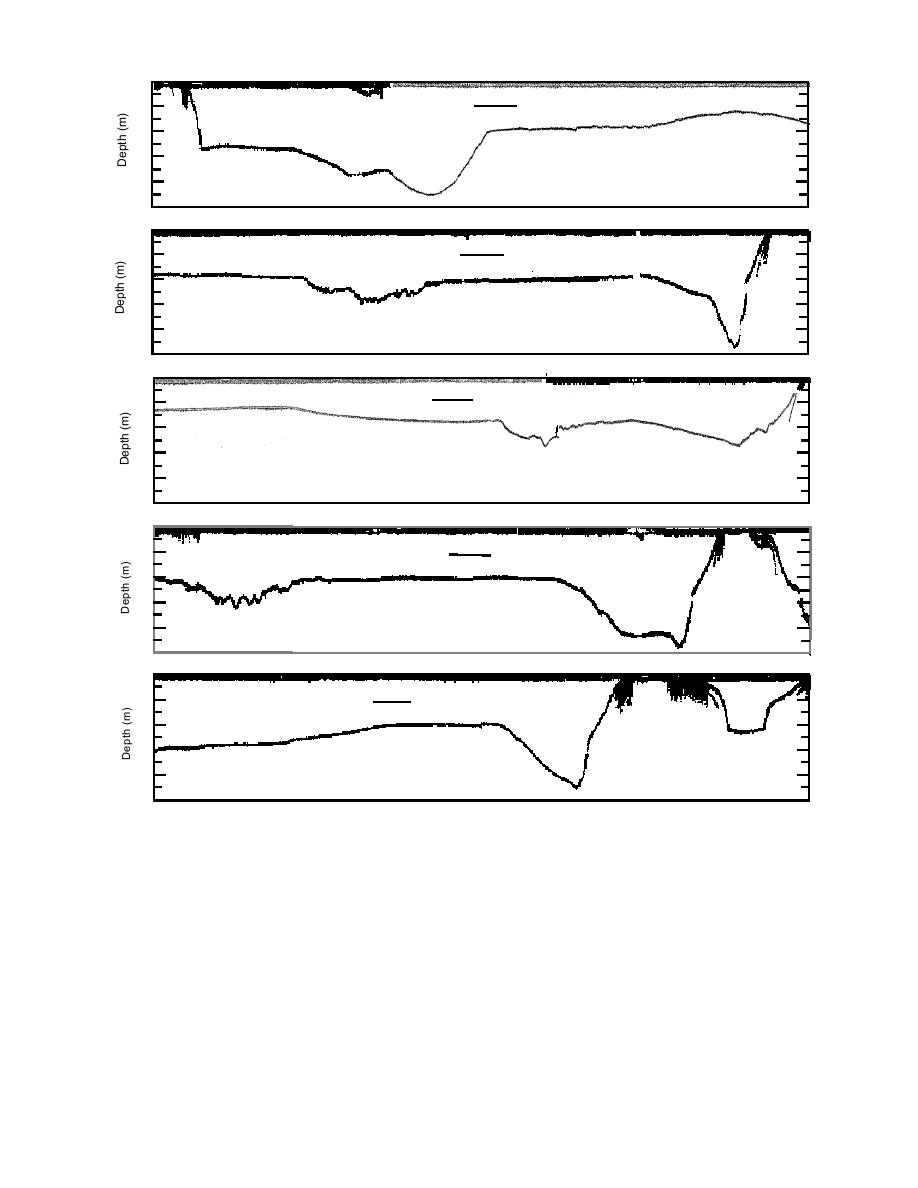
Figure 67. Bathymetric profiles. Refer to Figure 20 for profile locations.
extent of this effect, and since the site was moni-
the surrounding pond surface and indicate that
tored only in 1993, these data cannot be corre-
C-pond was an area of ground water discharge.
lated with our 1994 piezometer data.
The variability in water table elevation through
The scanty data on ground water conditions
time was only recorded from the monitoring well
suggest that tidal inundation interacts with the
in B-Gully (Fig. 68 and 70). These data show that
ground water system, but the precise nature of
the water table fluctuates as a function of tidal
that interaction is unknown. There is a clear need
for analysis of ground water conditions before its
do not fully inundate the mudflats. There is, there-
effects on WP remediation can be interpreted.
fore, a subsurface hydraulic connection between
Ground water fluctuations may be critical to mea-
tidal water and ground water at this site. How-
sures requiring drainage and drying of sediment.
ever, there are no data available to determine the
55


 Previous Page
