Table 13. Comparison of predicted and measured number of flooding events
reaching critical heights during summer and fall 1994. Measured data based on
depth transducer at Bread Truck Gully.
Number of flooding events
Anchorage predicted
Measured
Critical height
Summer 1994*
Fall 1994*
Summer 1994
Fall 1994
Inundate ponds (4.6 m)
16
21
52
23
Cover mudflats (4.87 m)
8
11
18
18
Cover levees (5.21 m)
0
5
4
7
*Summer 1994 (22 May to 15 Sept).
*Fall 1994 (16 Sept. to 9 Nov).
8
Coast
Upland
30
6
4
20
2
10
0
20
40
60
80
100
0
400
800
1200
Vegetative Cover (%)
Cumulative Distance on Line (m)
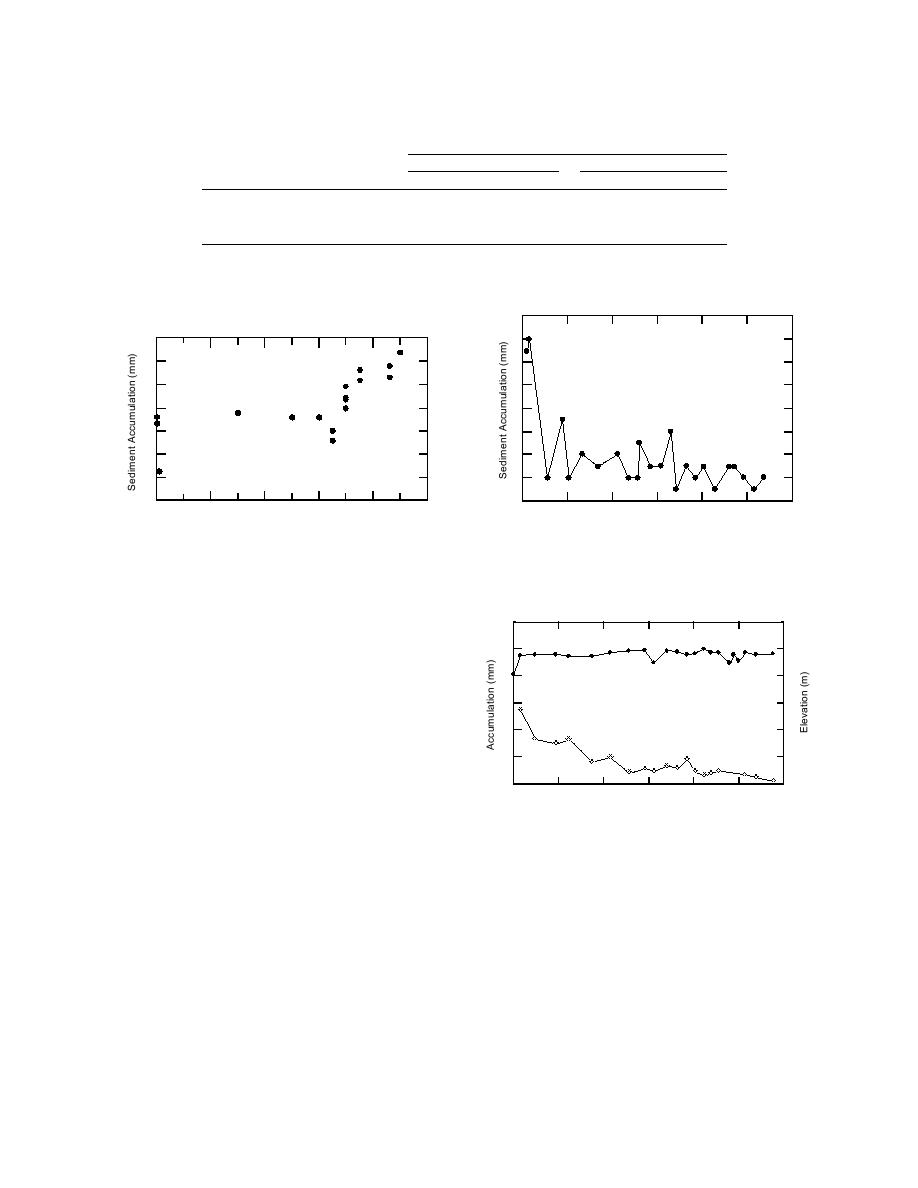
Figure 46. Accumulated sedimentation with dis-
Figure 45. Relation between total sediment accu-
tance inland from coast along line 16 in northwest
mulation recorded in September 1994 and vegeta-
Area A.
tive cover at sites sprayed with paint in 1992.
of the tidal effects by such factors is considered,
24
6
East
the number of inundations increases (Table 13).
There were significantly more tidal floods at the
Elevation
Bread Truck hydrostation during the 1994 season
4
16
than were predicted by the tide chart elevations.
The increase was on the order of twice that pre-
dicted for the summer period. The increase dur-
8
2
ing the fall was much less evident and correlates
Accumulation
with a seasonal reduction in river discharge.
0
The amount of vegetative cover in the mudflats
0
200
400
600
influences the sediment accumulation rates. Sedi-
Distance (m)
ment accumulation vs. vegetation cover at sites
Figure 47. Sediment accumulation and elevation along
first established in 1992 are correlated in Figure
transect line 18 in Area A. East end of line is located at
45. Gross sedimentation rates at these longest-
river levee.
established sites had 2-year total accumulations
flooding reduces their ability to transport sedi-
of 618 mm at sites with less than 6065% vegeta-
tive cover, and 2632 mm at sites with a vegeta-
ment, causing rapid sedimentation near the coast,
tive cover greater than 70%.
with less material available further inland. The
Sedimentation rates also vary with distance
same effect is often seen along the scarp of many
gullies where flow conditions change rapidly as
from source waters. A decrease in sedimentation
flood waters overtop gully banks. Sedimentation
rate with distance inland is best documented along
rates in general decrease with distance from the
transect 16 (Fig. 46), which extends southward
from Knik Arm in coastal Area A (Fig. 7). De-
Eagle River inland toward the marshes abutting
creased velocities of Knik Arm waters during
the uplands (Fig. 47).
35


 Previous Page
