4000
2000
0
20
0
20
10
0
2
0
15 Sep
18 Aug
22 Aug
26 Aug
30 Aug
3 Sep
7 Sep
11 Sep
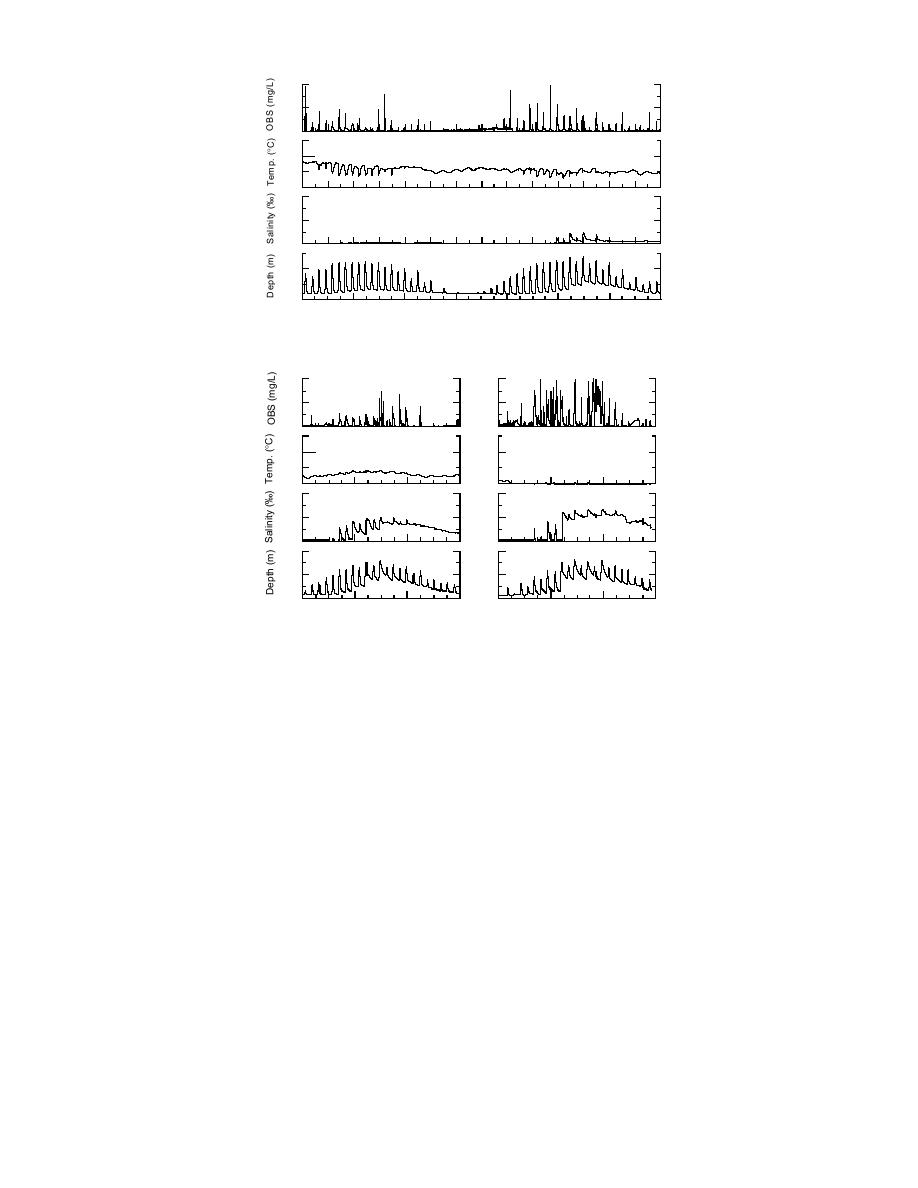
a. 18 August14 September 1994.
4000
2000
0
20
0
20
10
0
4
2
0
10 Nov
1 Oct
5 Oct
9 Oct
13 Oct 29 Oct
2 Nov
6 Nov
c. 29 October9 November 1994.
b. 113 October 1994.
Figure 35. Hydrostation record at Otter Creek.
vary among sites through a single tidal cycle,
SEDIMENT TRANSPORT
depending upon local runoff variations, pond stor-
AND SEDIMENT SOURCES
age and how effectively the gully moves water
Sediments are deposited in ponds and mudflats
out of the local area (Fig. 37).
mainly through suspension settling from pond
A typical pattern in TSS response through a
and flood waters (Table 5). Sediment is derived
flooding cycle is a sharp increase owing to highly
from two external sources: the Eagle River and
turbid flood water and resuspended gully bed
Knik Arm. Internally, the erosion of riverbanks,
sediment (Fig. 38). TSS values remain high through
gullies, pond bottoms and mudflats by wind and
slack high tide and the start of ebb, but abruptly
water currents, ice, bottom feeding waterfowl, and
decrease during ebb runoff. The length of ebb
other mechanisms provides remobilized mate-
runoff depends on how well the gully or network
rials.
of gullies transfers water stored in the ponds and
Concentrations of suspended sediment vary
mudflats. The greater the volume of water stored
seasonally, through monthly tidal inundation pe-
in an area, the longer it will take for the gullies to
riods as well as through single tidal cycles (from
effectively drain the ponds. The decrease in sus-
flood to ebb) (Fig. 36). These concentrations ap-
pended concentration may reflect the loss of ma-
pear to vary with distance from the river and
terial by deposition on mudflats and in ponds.
coastal sediment sources (Fig. 36 and 37). Total
TSS concentrations vary seasonally in the Eagle
suspended sediment (TSS) measurements also
River, being high through July and August, with
31


 Previous Page
