6.0
1.0
1.0
F
5.5
1.8
0.4
0.8
0.2
0.8
0.2
0.6
0.6
1.6
5.0
0.4
1.0
1.4
4.5
51.9 m3/s
S
Water Discharge:
P
ediment Concentrations:
Aak =
e
42.0 mg/L
1.2
S
P ve.=
1.6 mg/L
4
4.0
0.8
ediment Discharge:
eak =
0.1 kg/s
0.6
C
Ave. =
20.9 kg/s
ontour Interval:
.2 m/s
3.5
5
0
5
10
15
20
25
30
35
Distance (m)
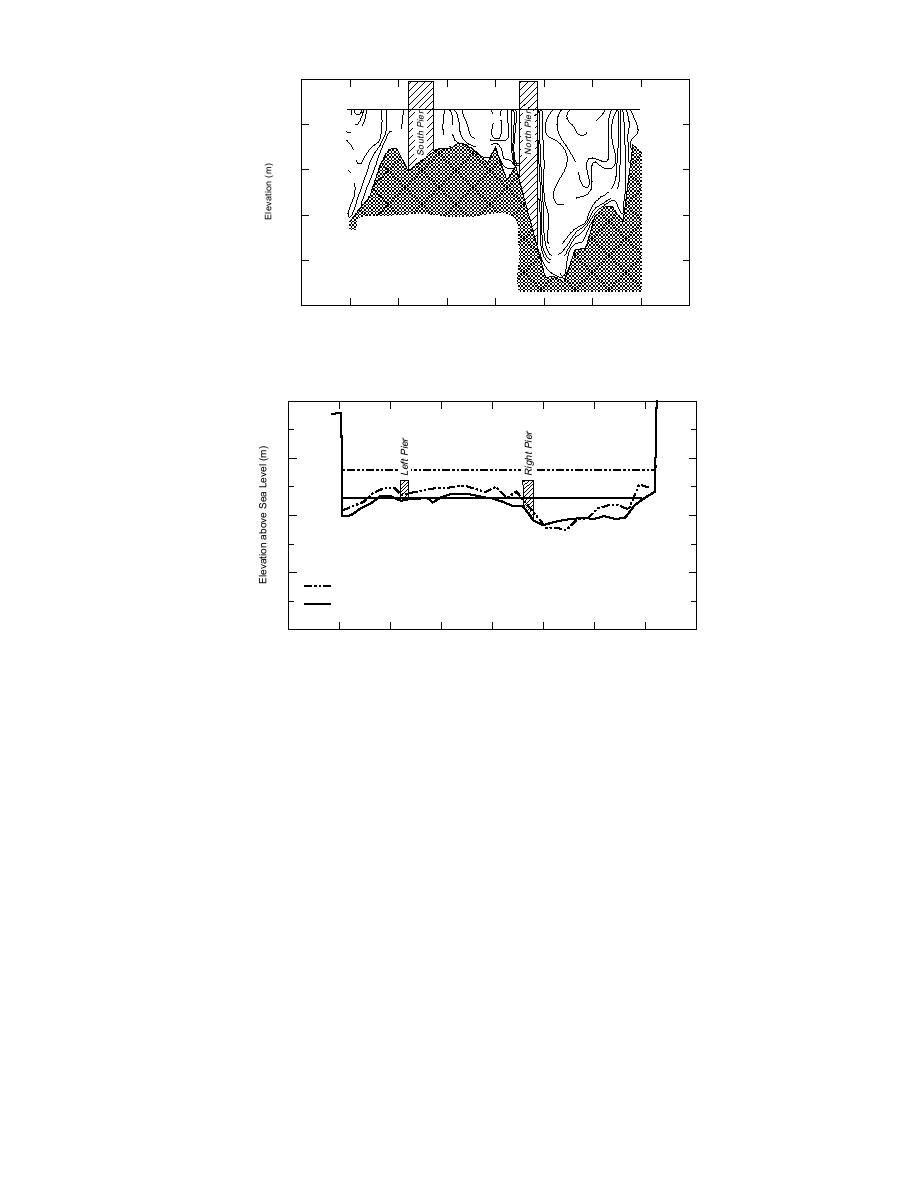
igure 41. Velocity profile for Eagle River on 5 September 1994 with
estimates of discharge (sediment and water).
8
6
4
Water Level and Bed Profiling Date:
2
May 17, 1994 (cross-sectional area = 9.7 m2)
September 5, 1994 (cross-sectional area = 24.0 m2)
0
5
0
5
10
15
20
25
30
35
Distance (m)
Figure 42. Comparison of Eagle River profiles from 17 May and 5
September 1994.
May and 5 September), the latter as part of an
channel survey can be estimated if the discharge
exercise to measure the velocity profile of the
is assumed proportional to the cross-sectional area
Eagle River (Fig. 41). Velocity was measured about
of the river. In May it was 40.6% smaller than in
every meter across the bridge at approximately
September. Using this assumption, we calculated
a river discharge of 8.9 m3/s, while the estimated
30-cm (1-ft) depth increments. The water stage in
early September is relatively high because of sea-
average and peak sediment fluxes were 0.34 and
sonal runoff from Eagle Glacier, and velocity
0.45 kg/s. This estimated discharge is similar to
the 19661975 average of 6.8 m3/s for the month
ranged from below 0.2 m/s to about 1.9 m/s with
a discharge of 21.9 m3/s. TSS values measured at
of May from the USGS (USGS 1981).
the river ISCO averaged 44.6 mg/L with a peak
of 52.0 mg/L. Using these values, we estimated
average and peak sediment flux to be 0.9 and 1.1
SEDIMENTATION
kg/s respectively.
In May the channel profile was measured at
Suspension settling occurs during slack high
Bravo Bridge, yielding a cross-sectional area of
tide and the early stages of the ebb cycle. In
9.7 m2 (Fig. 42). TSS measurements during May
ponded areas, it also happens between tides when
averaged 11.1 mg/L with a peak of 30 mg/L.
water turbulence is low and fine particles settle
River discharge and sediment flux during the
out of the water column. Therefore, the longer
33


 Previous Page
