length of time for recovery in base level than
that expected from tectonic adjustment
alone.
The subsequent uplift and increase in
flood water volume also induced gully ero-
sion across ERF; this is evident by an in-
crease in gully entrenchment, the formation
of knickpoints* and progressive headwall
N
migration into the mudflats and ponds. The
most prominent knickpoints are the steep
headwalls at plunge pools in gully heads.
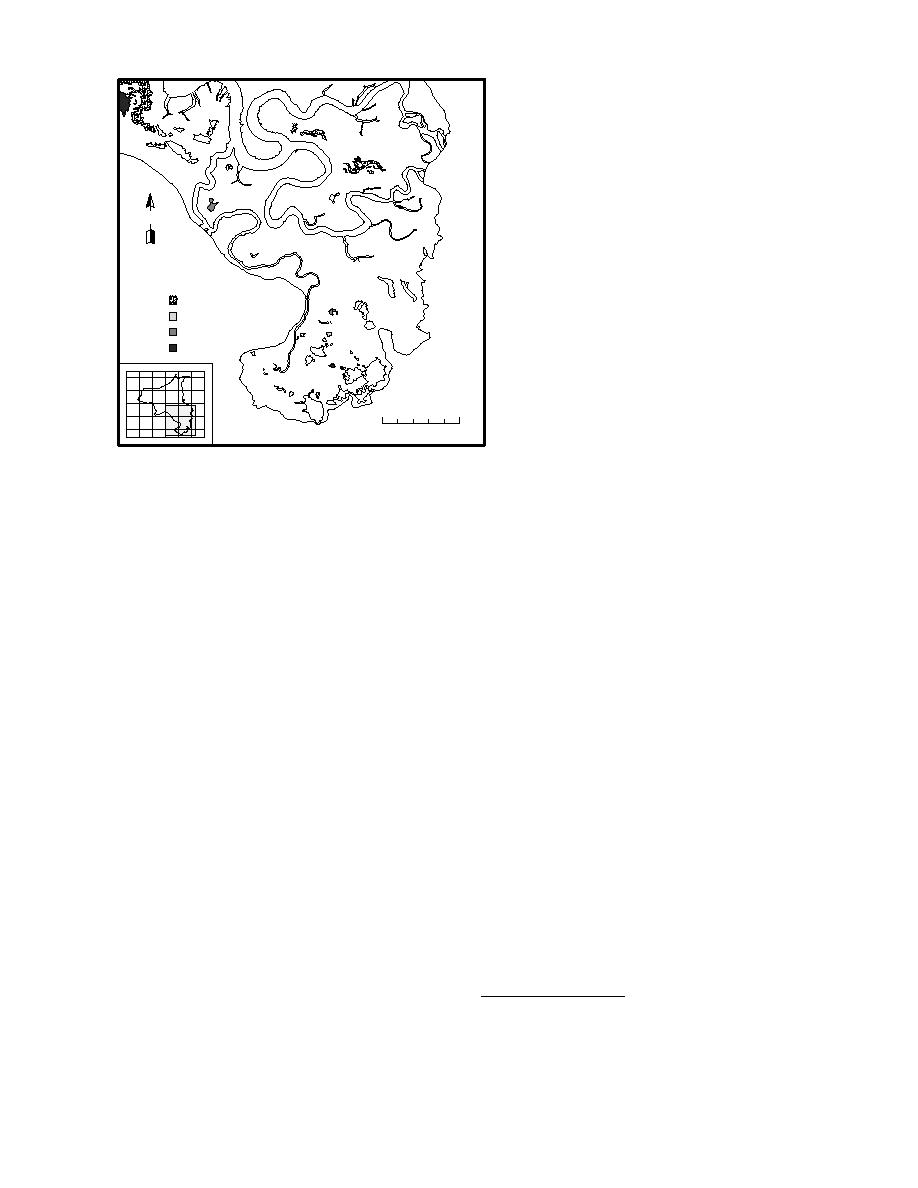
A 1994 Pond Sediment
As uplift continues, the gradient of the gully
-- cumulation (mm/summer):
c
------------------------
bed steepens relative to mean tide. Gully
5
0-05
incision results from scour of the bed as the
1 -10
10-15
volume and rate of discharge increase. Gully
5-20
c
knickpoints migrate up-gradient, reducing
the slope of the longitudinal profile by
scour and progressively lowering the down-
channel gradient (Fig. 49). Gully incision and
headwall erosion will continue as long as
0
500 m
the overall base level is lower than the one
that existed prior to the 1964 earthquake;
. Southern tile.
once tectonic stability is attained, an equi-
Figure 48 (cont'd).
librium gully slope profile will develop and
gully extension should cease.
Driving mechanism
Erosion and recession rates
Headwall erosion is progressively elongat-
and system response
Gully and river erosion in ERF may best be
ing gullies into the mudflats, towards the ponds.
described as a complex response to external and
Eagle River is also laterally migrating, transport-
internal factors (Table 7), particularly the 1964
ing the eroded sediment down-river towards Knik
Alaskan earthquake. Brown et al. (1977) concluded
Arm.
that the Anchorage area subsided 6070 cm dur-
The amount of recession of scarp crests is
ing the earthquake, followed by a post-seismic
highly variable within a gully, as well as among
recovery of about 1.5 cm/yr. However, gravity
the individual sites (Table 14, App. B). At each
and tide gauge data indicate that the rate of uplift
site, some parts of the scarp crests did not re-
has been decreasing. Accordingly, up to 45 cm (or
treat at all, and in fact, extension was measured
about 65%) of the recovery may have occurred
where tension cracks developed at an early stage
through September 1994. The physical system
of collapse. This variability in recession rates is
therefore has been and now is complexly respond-
evident in plots of the scarp crest location with
ing to an initially rapid reduction in base level,
time (Fig. 50 and 51). Recession rates for the
which is now being followed by a gradual rise as
September 1993 flooding cycle were a maximum
isostatic recovery takes place.
of 1.4 m, while 3.8 m was observed at Bread
The ponds' and mudflats' initial response to
Truck Gully during the fall of 1994 (Table 14,
subsidence probably was a significant increase in
Fig. 50d). Recent monitoring of erosion along
deposition in them, as the potential energy de-
the Eagle River recorded recession rates of 2.3
creased with the lowering of the surface elevation
m during the summer and 2.0 m during the fall
closer to that of mean Anchorage sea level. The
of 1994 (Fig. 51), with maximum recession rates
of 3.7 m. Headward erosion in 1994 resulted in
the volume of water entering the Flats increased
the amount of sediment entering ponds and the
time available for suspension settling in the ponds,
* Knickpoints are locations of abrupt slope change in the
marshes and mudflats. Deposition will augment
longitudinal channel or gully profile and represent system
the rate of surface rise and thus may reduce the
disequilibrium.
37


 Previous Page
