may reflect the respective lengths of the seasons,
Individual
an increase in available sediment as indicated by
Average
TSS values during the early winter months (Fig.
39), the trapping of sediment by the snow and ice
cover, or the number of flooding events. Net ac-
Winter
1993-94
cumulation of sediment above paint layers
through August 1994 in Area C and D mudflats
Summer
1994
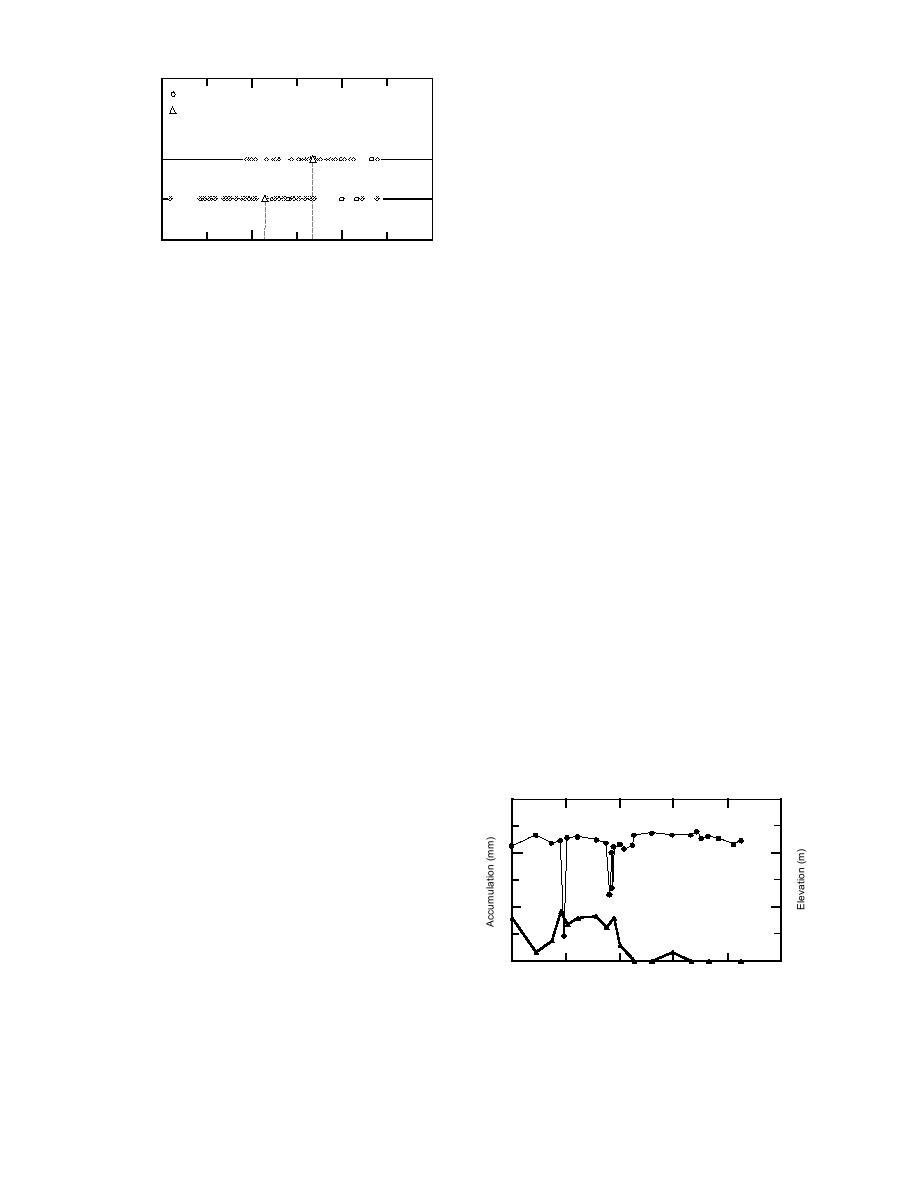
and levees are shown in Figure 43. Most winter
values fall in the range 215 mm, while the sum-
mer values range between 5 and 6 mm. The
10
0
10
20
Sediment Accumulation (mm)
negative summer values may result from com-
paction or erosion, or from the variability in sedi-
Figure 43. Net seasonal sedimentation rates at sites
mentation in the area from which measurements
sprayed with paint in August 1993 (winter 9394
are taken.
represents September 1993 through May 1994, sum-
The relationship of sedimentation rate to el-
mer 94 represents May 1994 to September 1994).
evation is a response to the number of times the
Circles represent individual sedimentation measure-
sites are inundated. Table 13 depicts the number
ments; the triangle and dashed line show the aver-
of events that would reach critical elevations to
ages.
flood different landforms, based on predicted tide
heights at the Anchorage tide gauge. The number
quiet water conditions can be maintained, the
of inundations is highest for ponds and decreases
greater is the time for deposition. The mixing and
with the increasing elevations of mudflats to
exchange of flood water with pond and marsh
levees, thereby correlating with the general de-
water increases the amount of suspended sedi-
crease in sedimentation rates (Table 12). An ex-
ment in the ponds and marshes, and provides the
ample of decreasing sedimentation rate with in-
primary source for deposition with each flooding
creasing elevation is revealed in the summer 1994
tide. Additional processes in gullies include
data for Transect 19 on Racine Island (Fig. 44).
bedload deposition, sediment flows and slump-
Sediment accumulation along the northern part
ing; these materials, however, may be remobi-
of the transect that crosses a low-lying, abandoned
lized and transported either into the pond areas
oxbow is much higher than in the elevated, veg-
or into the Eagle River, depending upon tidal
etated mudflat to the south.
The number of flooding events that we show
stage.
in Table 13 is a conservative estimate, since pre-
Controls on sedimentation rates at any par-
dicted tidal elevations do not account for higher
ticular location include elevation, vegetation that
tidal elevations from tidal amplitude increases
traps sediment, and the frequency, height and
caused by the geometry of Knik Arm (e.g.,
duration of inundations by sediment-laden wa-
McCann 1980a,b; Syvitski et al. 1987, p. 163), river
ters. The distance from the source water also plays
discharge, ice cover or wind. If the augmentation
a role in some areas, as sediment can be depos-
ited or eroded during flood and ebb, altering its
concentration. Local variability in deposition may
24
6
also result from ice rafting of sediment plucked
North
from other locations within the Flats.
Elevation
Sedimentation rates vary with morphology and,
4
16
in a general sense, elevation (Table 12). The over-
all trend in rates is an increase from levees to
mudflats, ponds, marshes and gully bottoms, with
2
8
the more heavily vegetated areas having higher
rates of accumulation. Typical annual sedimenta-
Accumulation
tion rates range from about 1030 mm among the
0
various landform types.
0
200
400
Distance (m)
Net accumulation rates are generally higher
during the "winter" 8-month period from Sep-
Figure 44. Sediment accumulation and elevation along
tember to May than during the "summer" 4-month
transect 19 on Racine Island. Northern lower-lying
section is located within an abandoned oxbow.
period from May to September. This difference
34


 Previous Page
