4000
2000
0
20
0
20
10
0
4
2
0
18 Aug
22 Aug
26 Aug
30 Aug
3 Sep
7 Sep
4 Oct
8 Oct
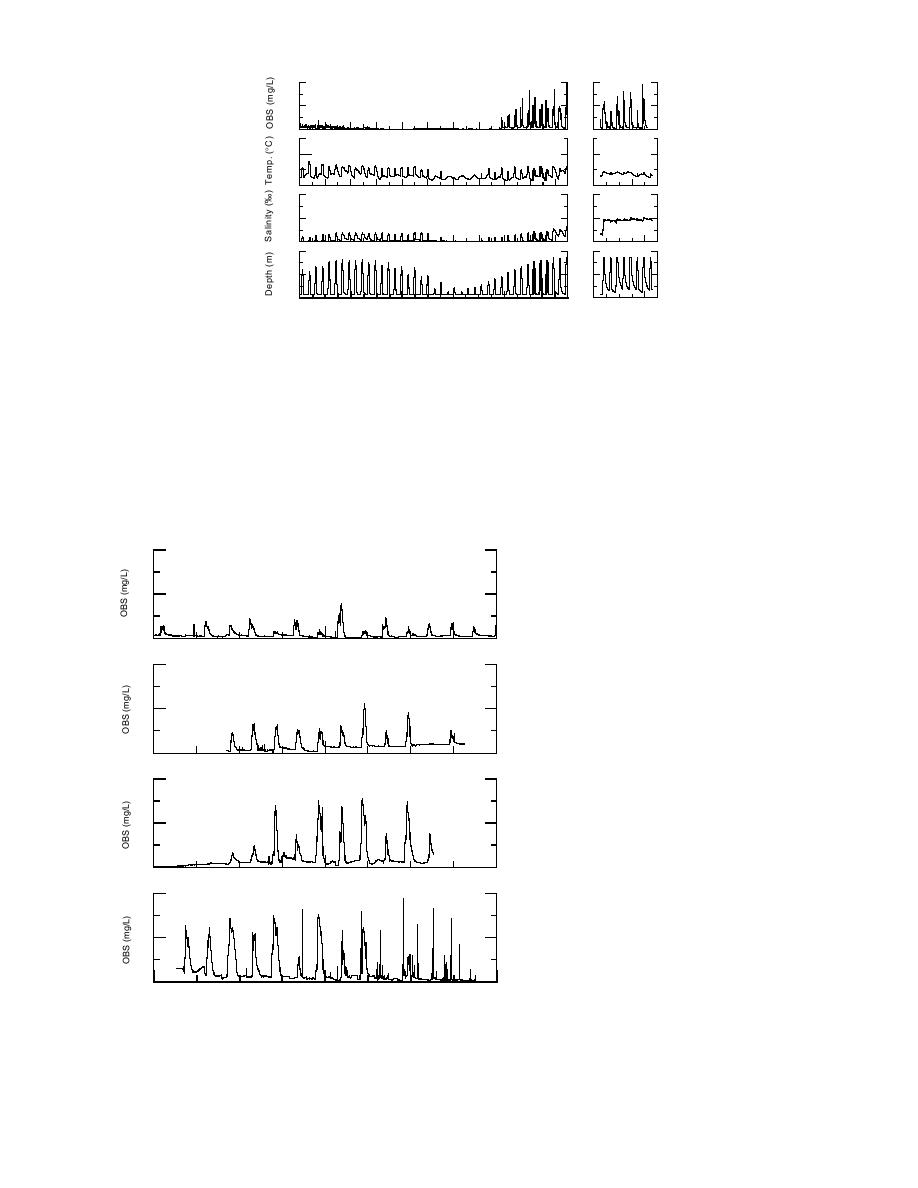
Figure 33. Hydrostation record at Spring Gully.
Salinity remains more uniform at the remaining
Otter Creek
sites--Bread Truck, B and Otter gullies--and this
Hydrostation data from the Otter Creek site
uniformity reflects the continuous flow of water
appear to confirm our 1993 hypothesis that the
out of the respective pond sources, each of which
dominant source water for this area is both Eagle
has ground water influx from springs. In general,
River and the upland springs that feed Otter
the peak turbidity levels, which are consistent
Creek, which enters ERF from the west. Salinity
with those of Knik Arm, increased during flood-
remained very low throughout the summer, in-
ing events through the season (e.g., Fig. 34).
dicative of the freshwater discharge from the up-
lands southwest of Area B (Fig. 35).
During tides without floods, water tem-
2000
peratures drop semi-diurnally to levels
similar to those recorded in Eagle River
1000
(Table 11). This behavior shows that
when high tide levels are low, Knik Arm
0
waters lack momentum and time to pen-
20 Jun
24 Jun
28 Jun
etrate deep into the ERF river drainage
2000
system (i.e., Area B); however, back-
pressure from inflowing tidal water ap-
1000
pears to dam the Eagle River and divert
it into Otter Creek and the southwest-
ern reaches of the Flats (Fig 35a). Dur-
0
3 Sep
7 Sep
11 Sep
ing the extremely high tides of late fall,
2000
Knik Arm waters did have enough en-
ergy and elevation to penetrate deep
into this area, as indicated by the salin-
1000
ity increases in Otter Creek at that time
(Fig. 24). The salinity increase at Otter
0
Creek during the November floods is
2 Oct
6 Oct
10 Oct
longer and more pronounced (Fig. 35c).
2000
The snow cover on the Flats at that time
retarded the runoff during ebb because
1000
of its capacity to store flood water. Its
slow release probably was the primary
cause of the longer period of high sa-
0
2 Nov
6 Nov
10 Nov
linity. Drainage through the porous
Figure 34. OBS levels at Parachute Gully during flooding periods
snow is much slower than normal ebb
in June, September, October and November 1994.
runoff without snow.
30


 Previous Page
