4000
2000
Coast ISCO
Spring Gully
Parachute Gully
Bread Truck
Mortar Gully
1994
3000
Parachute
Tanker
Otter Gully
River
Otter Creek
1000
2000
1000
0
0
4 May
3 Jun
3 Jul
4 Aug
1 Sep
1 Oct
31 Oct
6 Sept
7 Sept
8 Sept
9 Sept
10 Sept
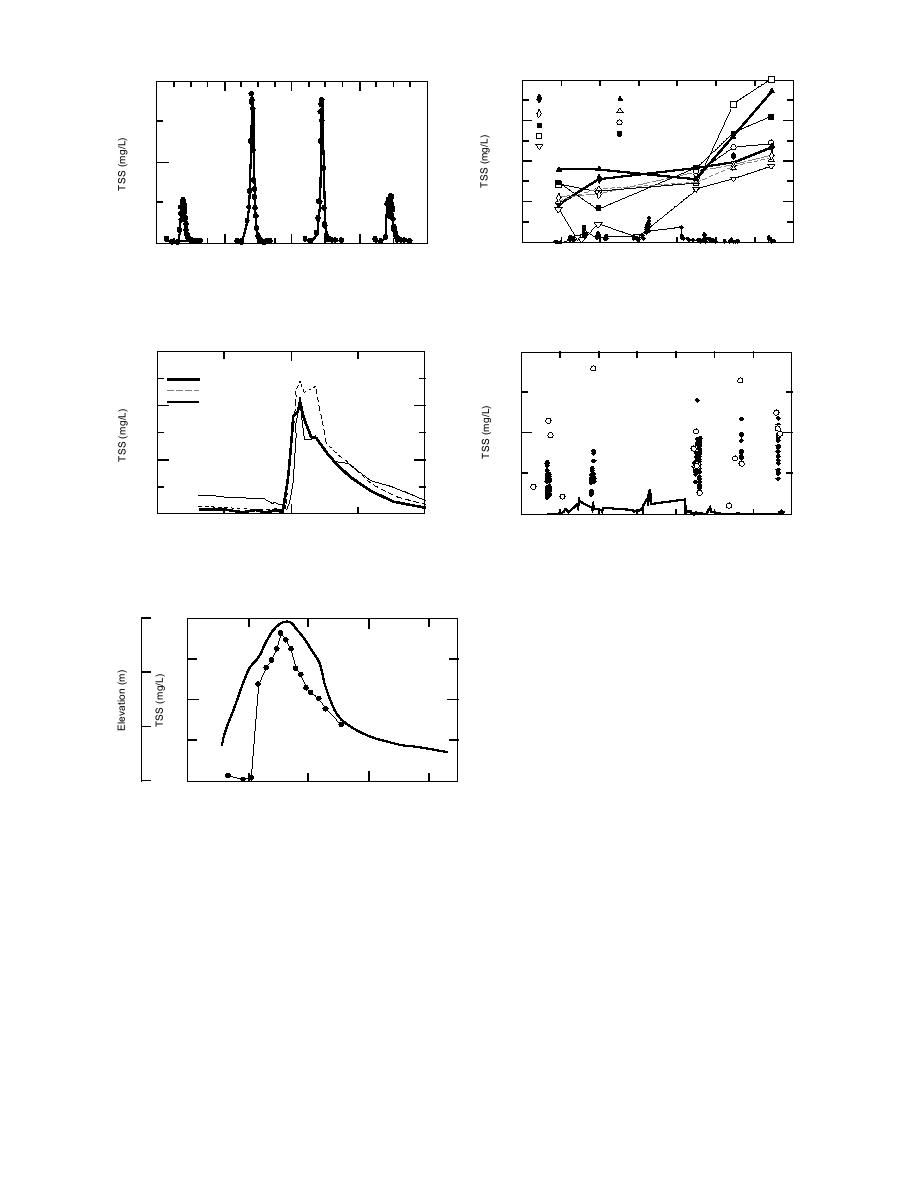
Figure 36. TSS measurements at Parachute Gully
Figure 39. Maximum monthly TSS measurements.
through four tidal cycles in September 1994.
3000
4000
3-4 November 1994
Coast-Grab
Mortar
Tanker
Bread Truck
2000
2000
Coast-ISCO
1000
River
Site
0
0
12:00
18:00
00:00 (hr)
4 May 3 Jun
3 Jul
2 Aug
1 Sep
1 Oct
31 Oct
30 Nov
Figure 37. TSS measurements at coastal sites during
Figure 40. Coastal vs. river TSS measurements.
single tidal cycle, 34 November.
1600
6
and show a general increase in sediment concen-
tration through the season (Fig. 40). We observed
Elevation
gradual early season increases, as well as sharper,
5
late-season increases in the peak TSS values of
both the Knik Arm and gully sites. Late-season
800
increases in TSS also correlate with increases in
4
OBS turbidity measurements at the hydrostations,
TSS
as will be described subsequently.
Trends in TSS related to location in the Flats
0
3
were not observed until the October and Novem-
18:00
00:00 (hr)
6 Oct 1994
7 Oct 1994
ber cycles, when TSS values of sites near the coast
were generally lower than at other sites, but were
Figure 38. Typical TSS variation through a flooding
comparable to those observed in Knik Arm wa-
cycle.
ters (Fig. 39). The extremely high TSS values at
inland sites during the fall flooding cycles prob-
glacially induced sediment peaks in mid-June and
ably reflect a stronger influence of sediment trans-
early August (Fig. 39). However, the relative lev-
port from internal sources such as riverbank and
els of TSS concentrations in the river are quite
gully erosion, perhaps ascribable to freezethaw
low compared with simultaneous values mea-
effects on bank and mudflat materials.
sured at mudflat gully sites and in Knik Arm.
Unfortunately, the USGS stopped monitoring
These data tell us that Knik Arm, and not the
of the Eagle River by 1981, so that there is no
Eagle River, is the main external sediment source
continuous record of water or sediment discharge.
for ERF. Coastal TSS measurements exceed those
However, the channel profile at Bravo Bridge was
at the river throughout the monitoring period
measured twice during the summer of 1994 (17
32


 Previous Page
