Table 10. Pressure sensor elevations and peak high tide delay relative to pre-
dicted time at Anchorage gauge.
Sensor
Average delay time
elevation
(min)
Site*
(m)
Jun
Jul
Aug
Sep
Oct
Nov
Mortar Gully
2.79
19.1
20.9
25.4
25.8
23.0
Bread Truck Gully
2.76
22.3
21.0
18.9
27.1
29.9
28.2
Tanker Gully
3.08
24.9
26.2
27.8
Spring Gully
1.60
21.1
22.5
27.5
23.4
23.5
Parachute Gully
3.29
25.3
23.6
26.1
30.4
29.7
33.5
B-Gully
3.11
31.8
30.5
30.0
Otter Gully
2.87
4.0
25.9
31.3
30.1
31.0
Otter Creek
2.20
38.4
38.5
53.5
47.6
43.4
* Arranged by increasing distance from Knik Arm Coast.
Spring Gully and Mortar Gully are generally
tern and fluctuations in the salinity and OBS sig-
first to reach peak high tide because they are
nify tidal flooding and mixing of different water
close to the coast and independent of river influ-
masses, as will be discussed later in more detail.
ence (Table 10). Otter Creek has the greatest lag
Data from a single flood and ebb cycle show
time owing to incomplete drainage of the creek
the basic relationships of water quality param-
between flooding tides and distance from the
eters and inundation (Fig. 32). Initially, as the
coast. During periods of flooding tides from Au-
water level in the gully rises during flood, param-
gust to November, the tide was still rising at Ot-
eters remain at values characteristic of the incom
ter Creek while the rest of the stations re-
corded ebb. This order of peak high tides
2000
between sites varies slightly from month to
1000
month, indicating that additional factors
0
affect the rate of tidal inundation.
20
0
WATER QUALITY PARAMETERS
20
AND TIDAL FLATS HYDROLOGY
10
0
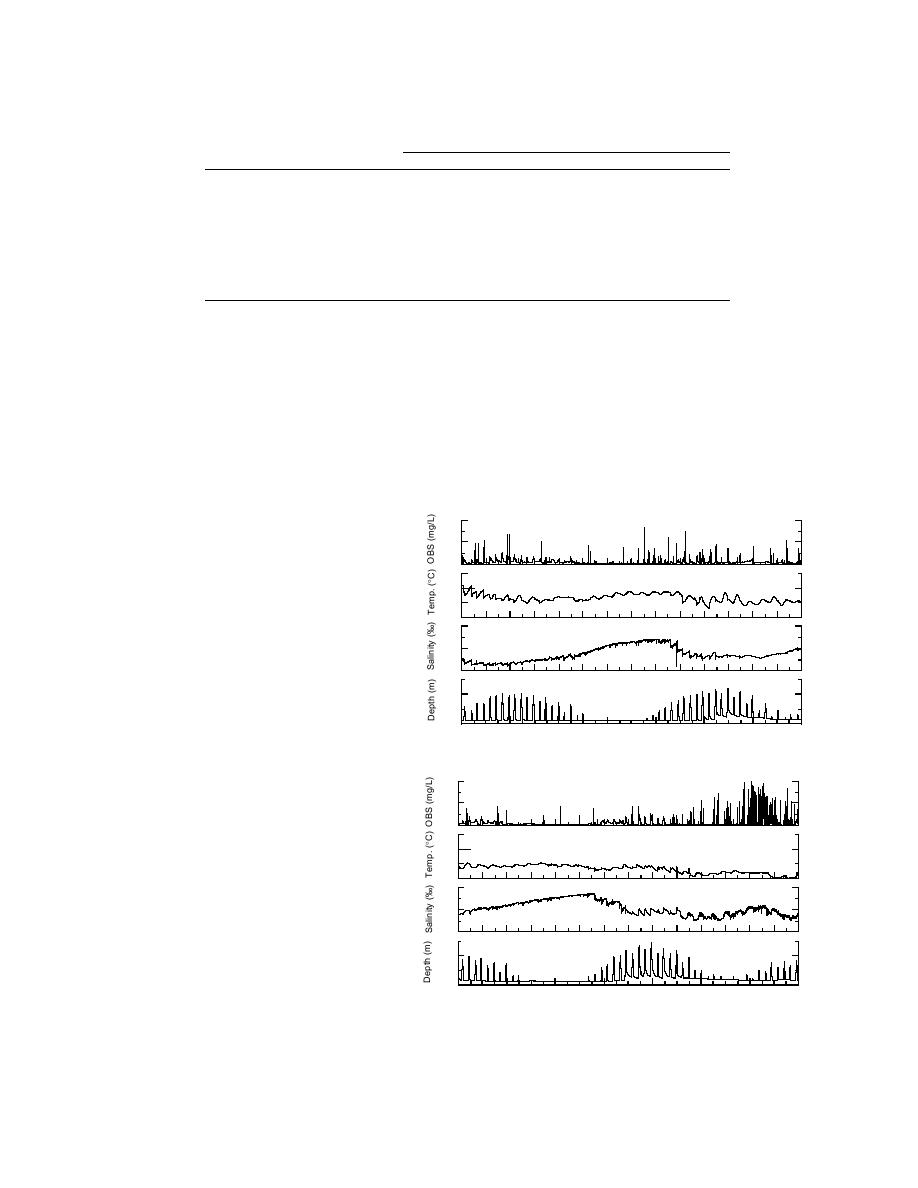
Knowing water quality parameters dur-
ing tidal flood and ebb is critical to under-
2
standing the interplay of tidal flood waters
0
and river discharge and its influence on
18 Aug
22 Aug
26 Aug
30 Aug
3 Sep
7 Sep
11 Sep
15 Sep
sedimentation in the Flats. The hydrostation
a. 18 August14 September 1994.
data plotted in Figure 31 bespeak the pa-
2000
rameters controlling sedimentation across
the Flats. These data can be used to deter-
1000
mine critical hydrological elements, such
0
as duration of inundation (depth), river vs.
20
tidal water domination (salinity and tem-
perature), and sediment transport (OBS).
0
20
For example, Figure 31a presents water
quality data for about 1 month (18 August
10
to 14 September) where an earlier sequence
0
of high tides was only high enough to fill
2
the gullies, and a later sequence flooded
onto the mudflats. The record shows a daily
0
21 Sep
25 Sep
29 Sep
3 Oct
7 Oct
11 Oct
15 Oct
19 Oct
sinusoidal water temperature pattern when
b. 21 September18 October 1994.
tides are low (29 August1 September). Per-
Figure 31. Hydrostation record at Mortar Gully.
turbations to this regular temperature pat-
27


 Previous Page
