3.14
2.51
1.88
1.26
0.63
0.00
0.63
1.26
1.88
2.51
3.14
1.82
1.45
1.09 0.73
0.36
0.00 0.36
0.73 1.09
1.45
1.82
EastWest Component of Wavenumber (m1 )
Linear Grey Scale: White Regions = 3 dB
Black Regions = 42 dB
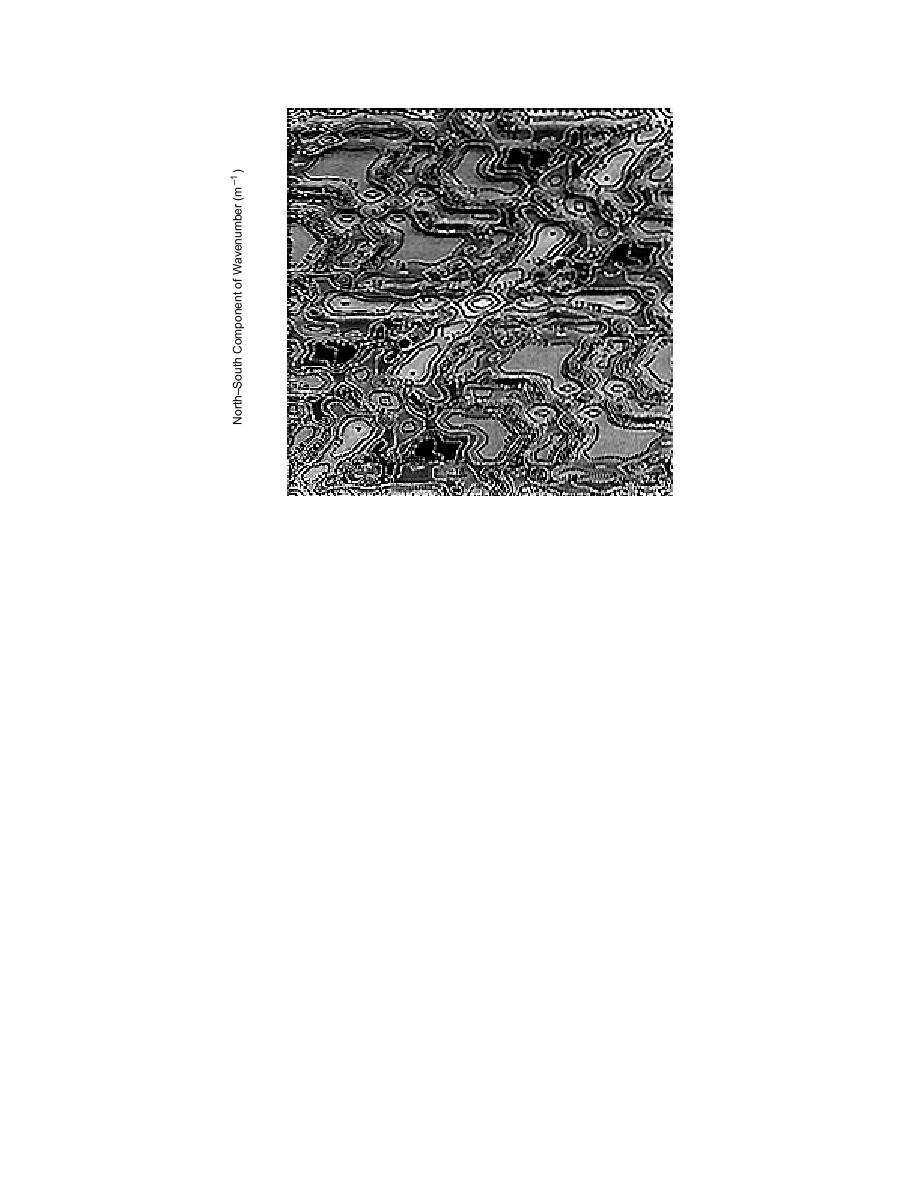
Figure 15. Grayling array impulse response. Plot ranges over kx and ky
Nyquist limits. Spectral resolution at 3 dB is 0.19 m1.
The impulse response for the 1989 Grayling
4. DISCUSSION OF SOURCE
array is shown in Figure 15. The plot ranges to the
CHARACTERISTICS
Nyquist wavenumber limits along the x and y
axes. The array factor is the x described by the 12-
To understand the direction estimates of mov-
dB high-amplitude ridge lines radiating from the
ing seismicacoustic sources it is instructive to
center of the plot. The inner contour at 3 dB
first consider the spectral properties of simpler
defines the spectral resolution for this array, which
sources. We therefore begin by looking at impul-
is 0.19 m1. The high-amplitude lobes seen intrud-
sive acoustic and seismic wave fields generated by
ing from the periphery of the plot toward the
a .45 caliber (blank) pistol shot and a vertically
center are grating lobes, which are a consequence
delivered sledgehammer blow. The pistol shot
of the periodic nature of the spectral estimation
was recorded around 1500 on 16 February, and the
procedure.
hammer blow around 1730 on the same day.
The Grayling array geometry is not optimal
All estimates of the phase velocities discussed
with respect to multiple source resolution or pro-
in this section are based on a time-domain move-
viding equal resolution capabilities from all bear-
out method. Each waveform in the time-domain
ing directions. Signals arriving from directions in
signal vector is synchronized by specifying the
the vicinity of 0 or 180 and 55 or 235 will be
source direction (θ) and phase velocity (Vo) of the
poorly resolved. Maximum source resolution lies
waveforms. Since the spatial distribution of the
at directions perpendicular to these values. The
array elements is known, we can calculate the
element spacing of the Grayling array has been
relative differences in arrival times between all
designed to allow coverage of a variety of possible
elements in the array. The time shift may be ex-
wavelengths ranging from 4 to 30 m.
pressed as
16


 Previous Page
