North
5
4
3
9
8 7
2
6
1
East
0
10
20 m
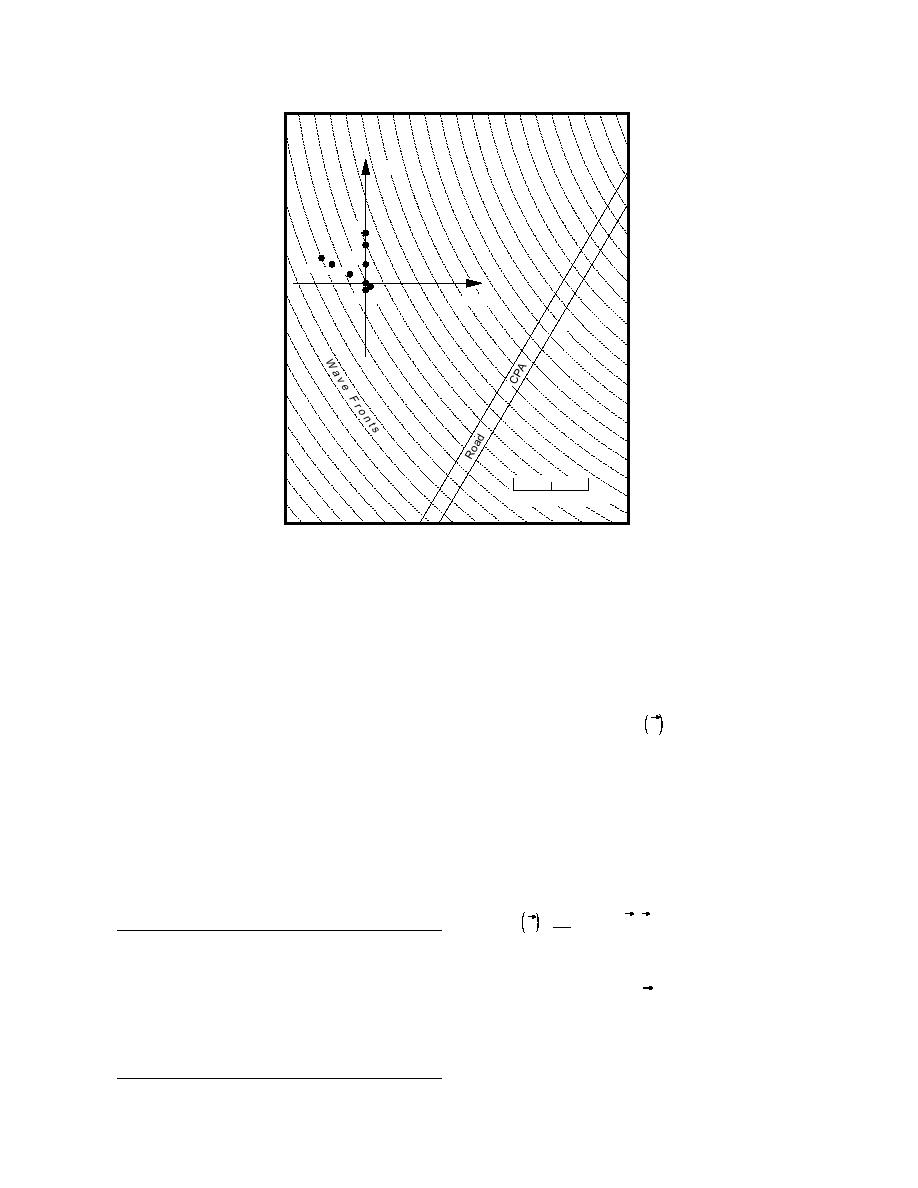
Figure 14. Grayling sensor positions and road, drawn to
scale. Relative sensor coordinates and associated channel
numbers are given in Table 6. North is referenced to the
magnetic pole. Dots () are sensor locations.
element crossed array with one of the legs perpen-
3.5. Characterization of the Grayling array
An important factor in qualitatively assessing
dicular to the test track. Figure 14 shows the sensor
the reliability of an estimated wavenumber spec-
positions, and Table 6 gives the relative element
trum based on the BT or ML methods is the pres-
positions. The array was calibrated by vertical
ence of the array factor [F k ] in the estimate. The
hammer blows and blank pistol shots from five
locations along the test track: at the closest point of
array factor is the zero-phase impulse response for
approach of the vehicle (CPA), and at 50 and 100 m
a given array geometry. The array impulse re-
on either side of the CPA. Shear waves from the
sponse provides important information on the
CPA were also recorded, as were pistol shots 50 m
direction-dependent resolution capability of the
from the array center at the remaining compass
array as well as an estimate of the beam width for
points.
an ideal plane wave. It is a relatively simple matter
to obtain such a response. The most straightforward
method is given by
Table 6. Seismic array element position.
M1
Element
E to W (m)
N to S (m)
1
∑
e ik Rm ,
Fk =
(31)
M
m=0
1
0.0
2.0
2
0.0
0.0
3
30.0
6.0
which is simply a Fourier transform of the array
4
0.0
12.0
element location vectors Rm. The procedure used
5
0.0
16.0
in this analysis is given by Kelley (1967) and differs
6
1.73
1.0
from eq 13 only in that it allows for the analysis of
7
5.0
3.0
8
10.4
6.0
a wideband array response based on a Gaussian
9
13.8
8.0
distribution of zero-phase energy.
15


 Previous Page
