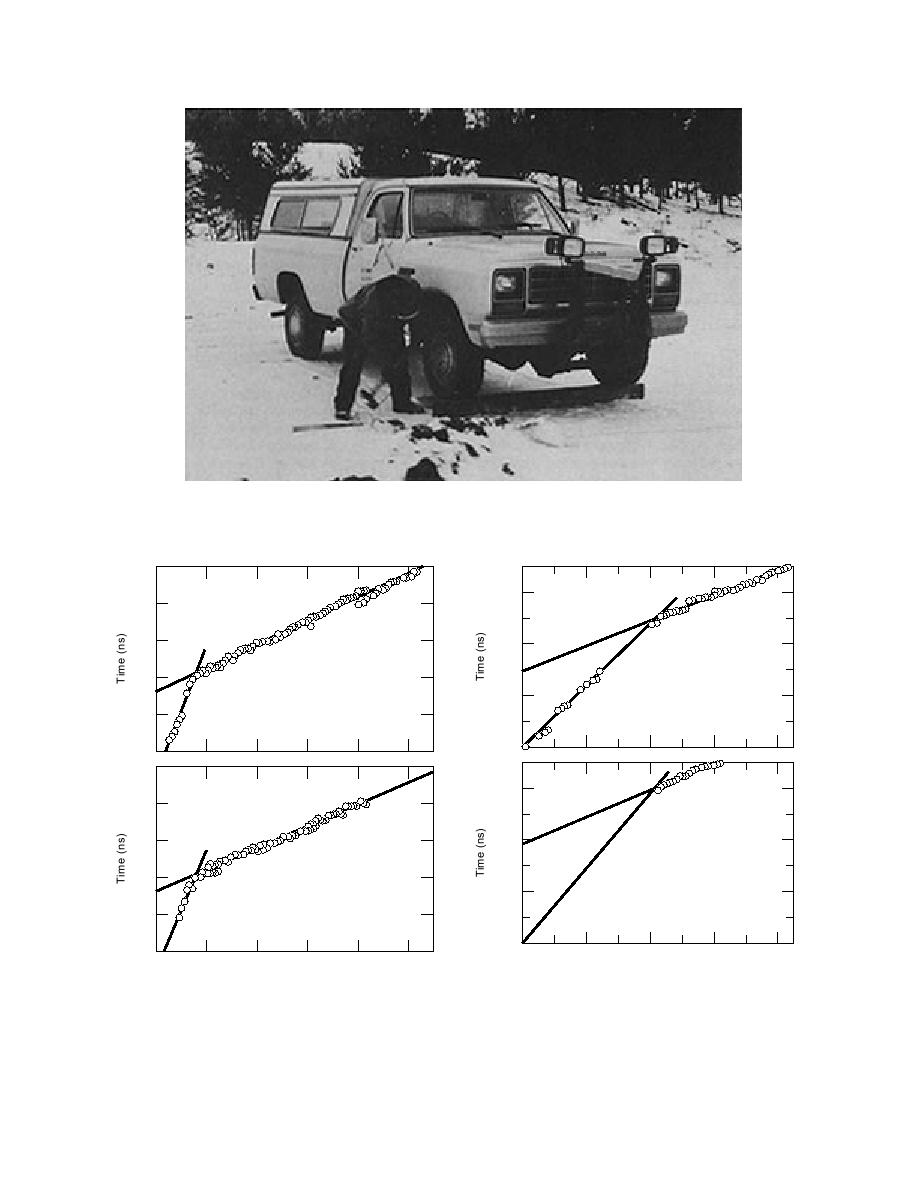
Figure 7. Generating shear waves for the site characterization measurements. The cable leading
from the sledgehammer allows the impact time to be recorded.
100
300
80
60
200
40
100
North
20
North
0
0
100
300
80
200
60
40
100
South
20
South
0
0
0
20
40
60
80
0
20
40
60
80
100
Range (m)
Range (m)
Figure 9. Shear (S) wave refraction travel time vs.
Figure 8. Compressional (P) wave refraction travel
distance. The straight lines are least-squares fits to the
time vs. distance. The straight lines are least-squares
travel time data. Shown are arrival times for waves from
fits to the travel time data. Shown are arrival times for
hammer sources located north and south of the linear
waves from hammer sources located north and south of
array of geophones.
the linear array of geophones.
11


 Previous Page
