Table 3. Analysis of seismic refraction travel time.
Apparent velocity
Intercept time
Depth
Dip
(m s1)
(ms)
Velocity
(m)
angle
(m s1)
Layer
South
North
South
North
South
North
(degrees)
Compressional (P) waves
1
276
301
0.0
0.0
288
4.78
4.80
2
1584
1749
32.6
32.8
1662
0.5
Shear (S) waves
1
167
137
0.0
0.0
152
12.2
15.7
2
417
386
148.3
191.2
401
with a speed of 400 m s1. Details of the intercept
downhole horizontal components of unknown
time analysis are given in Table 3. The seismic
orientation were rotated to the radial and trans-
water table depth is about 1 m less than the well log
verse orientations before the first arrivals were
depth, while the shear wave velocity change does
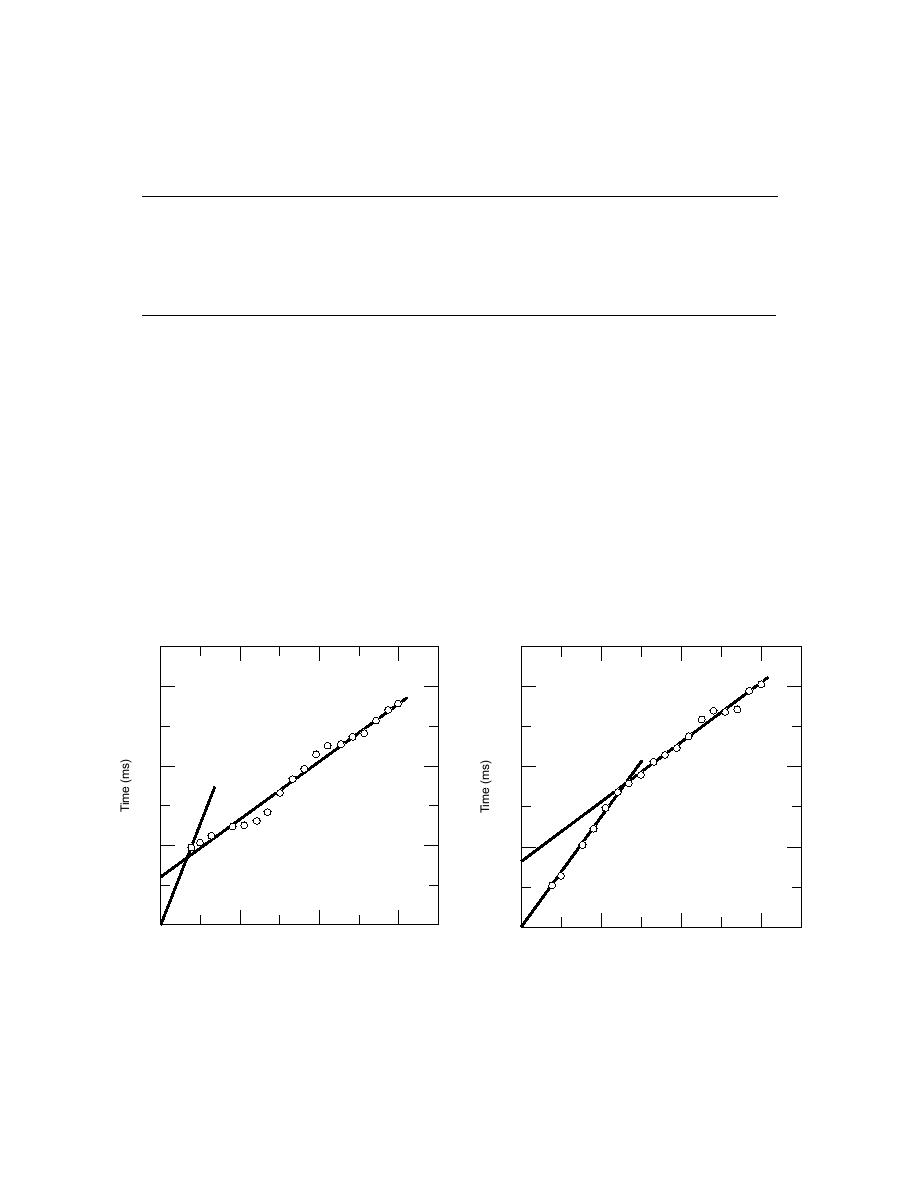
picked. Figures 10 through 12 show the resulting
not correspond to any obvious drill log layer. The
travel time curves for the P and S waves, with
vertical compressional and shear wave velocities
least-squares line fits used to determine the veloci-
of the shallow soil were also measured by clamp-
ties. These experiments indicate compressional
wave velocities of 390 m s1 at the surface, with a
ing a three-component geophone at various depths
1370-m s1 layer below, starting at a depth of
in a cased, 30-m-deep borehole and recording the
travel times of P and S waves from surface hits 3 m
around 3 m. The measured shear wave velocity
was 180 m s1 at the surface and 340 to 380 m s1 at
away from the top of the hole to the downhole
geophone. The seismograms from the two
a depth of 12 to 16 m. These results agree with the
30
120
20
80
10
40
0
0
0
10
20
30
0
10
20
30
Slant Range (m)
Slant Range (m)
Figure 10. Compressional (P) wave downhole travel
Figure 11. Transverse shear (S) wave downhole travel
time analysis. The least-squares lines give 180 m s1
time vs. distance. Straight-line ray paths were assumed
down to 12 m and 340 m s1 below that depth.
to calculate the slant distance from the measured sensor
depth and horizontal source offset. These lines yielded
values of 390 m s1 down to 3 m, underlain by a velocity
of 1370 m s1.
12


 Previous Page
