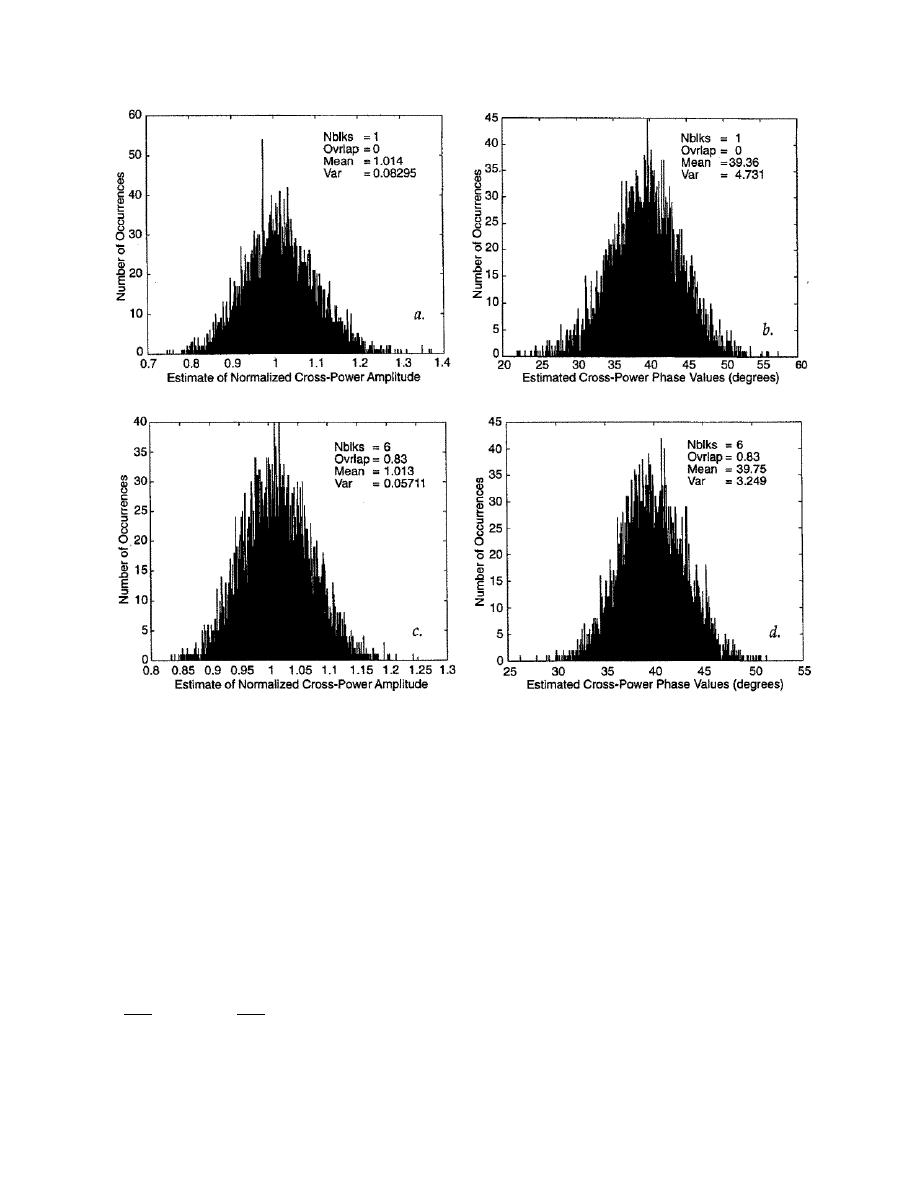
Figure 5. Histograms of cross-power amplitude and phase estimates at 20 Hz for a synthetic sine wave series
containing line spectra at 20 and 23 Hz with zero mean random noise. SNR is one. Sample populations for all
histograms are composed of 5000 estimates. All estimates utilized a Blackman window taper to reduce bias effects from
23 Hz spectral line. Cross-power histograms shown in (a) and (b) are based on estimates from blocks of 1024 data
points. Each estimate in the amplitude and phase histograms shown in (c) and (d) are based on six overlapped blocks
of 512 points each. The total series length is 1024 points, and each block overlaps the preceding block by 80%. Note
that the variance in histograms (c) and (d) is significantly smaller than the variance seen in (a) and (b).
tained for 5000 different random noise cases.
There are two degrees of freedom in this cross-
Using this sample population of cross-power val-
power estimate. Based on a sample population of
ues, the mean and variance of the amplitude and
5000 estimates, the amplitude mean is 1.014 with a
variance of 0.0829. The phase mean is 39.36 with
phase population can be estimated.
a variance of 4.7312. In Figure 5c and 5d the
Figure 5 shows cross-power amplitude and
phase estimate histograms using the Blackman
amplitude and phase histograms are calculated
window function (given by W(l) = 0.42 0.5 cos
but the series is estimated using blocks overlapped
( L/ π ) + 0.08 cos ( L/ π ) with l = 1, ... L). Figure 5a
4
2
by 80%. Thus, six partially independent blocks are
1
1
used in each amplitude and phase estimate. Again
and 5b are the amplitude and phase histograms for
using a population of 5000 estimates, the histo-
the case of estimates based on a single block of 1024
gram shown in Figure 5c gives an amplitude mean
points tapered with a Blackman window function.
8


 Previous Page
