20
15
10
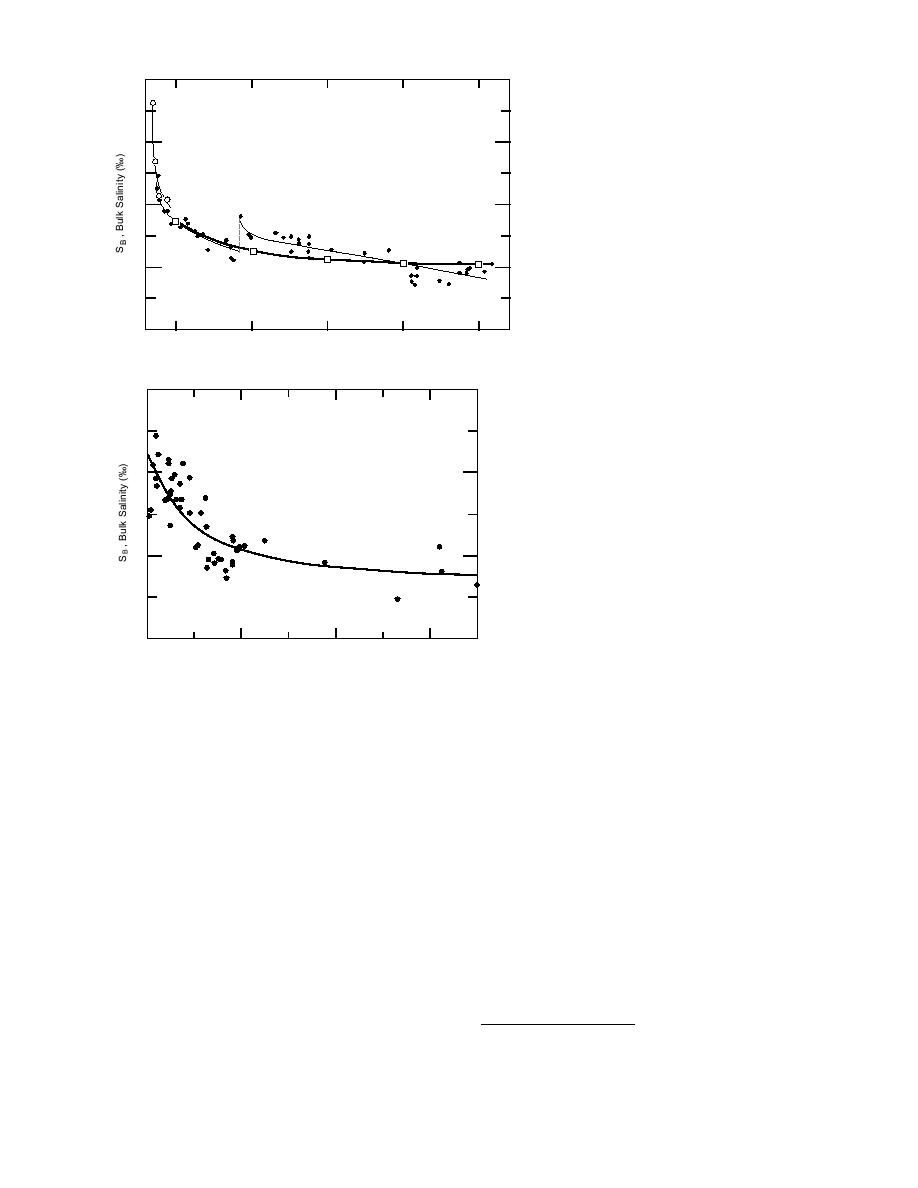
Figure 19. Comparison between the regres-
5
sion curve passed through all the bulk salin-
ity vs. ice floe thickness data in Figure 18 and
Date of Determination
the field data in Figure 7. The squares mark
1 Jan
1 Feb
1 Mar
1 Apr
1 May
0
the locations of the ice thicknesses used in the
24
54
85
90
95
regression equation given in Figure 18.
Avg. Ice Thickness (cm)
6
as boxes in Figure 19 with an interconnecting
curve. The agreement is good, considering that
2
SB = 1.40 + 121139.64/TF
ice sheet flooding in January affected ice
r 2 = 0.626
growth and morphology.
The results in Figure 18 are representative
4
of first-year sea ice during the growth season.
In the melt season, ice salinity decreases due
to accelerated brine drainage and flushing.
Disregarding impurity effects, the speed and
intensity of the melt process are highly de-
2
pendent on thermodynamic factors such as
air temperature, solar radiation intensity, snow
cover, and rain, as well as the thickness of the
ice. These factors govern how fast meltwater
0
forms on the ice surface and the speed at which
200
400
600
800
T F , Floe Thickness (cm)
solar radiation melts the ice around brine chan-
nels, pockets, and flaws to help open up the
Figure 20. Beaufort Sea multiyear ice bulk salinity vs. floe
drainage networks leading to the sea. As indi-
thickness.
cated in Figure 9, spring melt conditions can
effect of seawater salinity variation as well as
cause the bulk salinity of the ice to decrease by
first-year sea ice morphology and structure dif-
50% in one month. At high latitudes, where sum-
ferences on the bulk salinity of the ice. The litera-
mer melting is not as intense, the process of ice
ture certainly shows that this can be done under
freshening is slower. Here, more than one melt
controlled conditions (Cox and Weeks 1975, Weeks
season may be required to achieve the reduction
and Lofgren 1967) and during focused field mea-
in ice salinity shown in Figure 9. In lower lati-
surement programs where the highly variable ther-
tudes, the melt season is longer and sufficiently
modynamic conditions controlling sea ice growth
intense to completely melt the ice cover. Because
are measured and accounted for (e.g., Nakawo
the degree of ice freshening in one season is highly
and Sinha 1981, 1984; Wakatsuchi 1983; Eicken
variable, the salinity of second-year and older ice
1992). In the interim, Figure 18 provides a good
also varies, but the trend is decidedly to a lower
indication of the bulk salinity of first-year sea ice
bulk salinity for older ice.
vs. thickness.
Bulk salinity vs. second- and multiyear ice floe
It may be of interest now to see how the regres-
thickness data collected in the Beaufort Sea by
sion curve in Figure 18 fits the data in Figure 7.
Kovacs and Mellor (1971), Cox (1972*), Kovacs et
Using the five ice thicknesses given in Figure 7
and the equation in Figure 18, the bulk ice sheet
salinity was calculated. These values are shown
* Only published as shown in Figure 6.
11


 Previous Page
